Adding forecast as a metric calculation | Community
Skip to main content
New Participant
October 18, 2021
Solved

Adding forecast as a metric calculation

  • October 18, 2021
  • 2 replies
  • 1115 views

I try to make the following forecast trend using static number and Day as a filter:

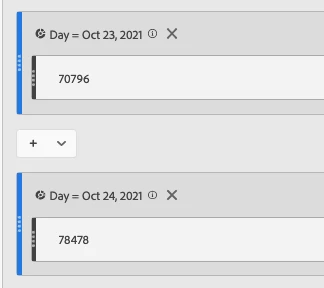
When I try to draw this metrics on a visual it sum both number on ever day. How can I make a statical forecast trend with different numbers for each day?

This post is no longer active and is closed to new replies. Need help? Start a new post to ask your question.
Best answer by Pablo_Childe

ok thanks for clarifying further. The main challenge here is user data on revenue is usually attributed at time of purchase via product/revenue data capture.


You almost would need a 3rd party powerBI like way to do this data insertion and comparison.


From what I see likely easiest way to go export data results, use excel to make graphs. APi insertion is possible but that leads to alot of work in other areas.


good luck

2 replies

Pablo_Childe
Pablo_ChildeAccepted solution
New Participant
October 19, 2021

ok thanks for clarifying further. The main challenge here is user data on revenue is usually attributed at time of purchase via product/revenue data capture.


You almost would need a 3rd party powerBI like way to do this data insertion and comparison.


From what I see likely easiest way to go export data results, use excel to make graphs. APi insertion is possible but that leads to alot of work in other areas.


good luck

Pablo_Childe
New Participant
October 18, 2021

Dont understand the logic here completely but I assume you are trying to create a metric whereby you trend against a future target number vs present day?


Not sure this is exactly what you are after but, if you created a calculated metric against a Dimension KPI.


In this case metric is pageviews x exp % change of 15 % increase.


Then you add 2nd calculated dimension vs reg dimension to see deltas.


Good luck

amendez92Author
New Participant
October 19, 2021

Hello! First of all, thank you for your reply.


What I need is the following. We are going to launch a Paid Media campaign and I have a revenue forecast type:
Day 1 - 100
Day 2 - 70
Day 3 - 65
Day 4 - 120
Day 5 - 90


What I want is to be able to plot this trend on a graph so that I can compare it with the actual result, type: