Attribution Modeling-First & Last touch | Community
Skip to main content
New Participant
September 10, 2023
Solved

Attribution Modeling-First & Last touch

  • September 10, 2023
  • 1 reply
  • 752 views

Hello Everyone,
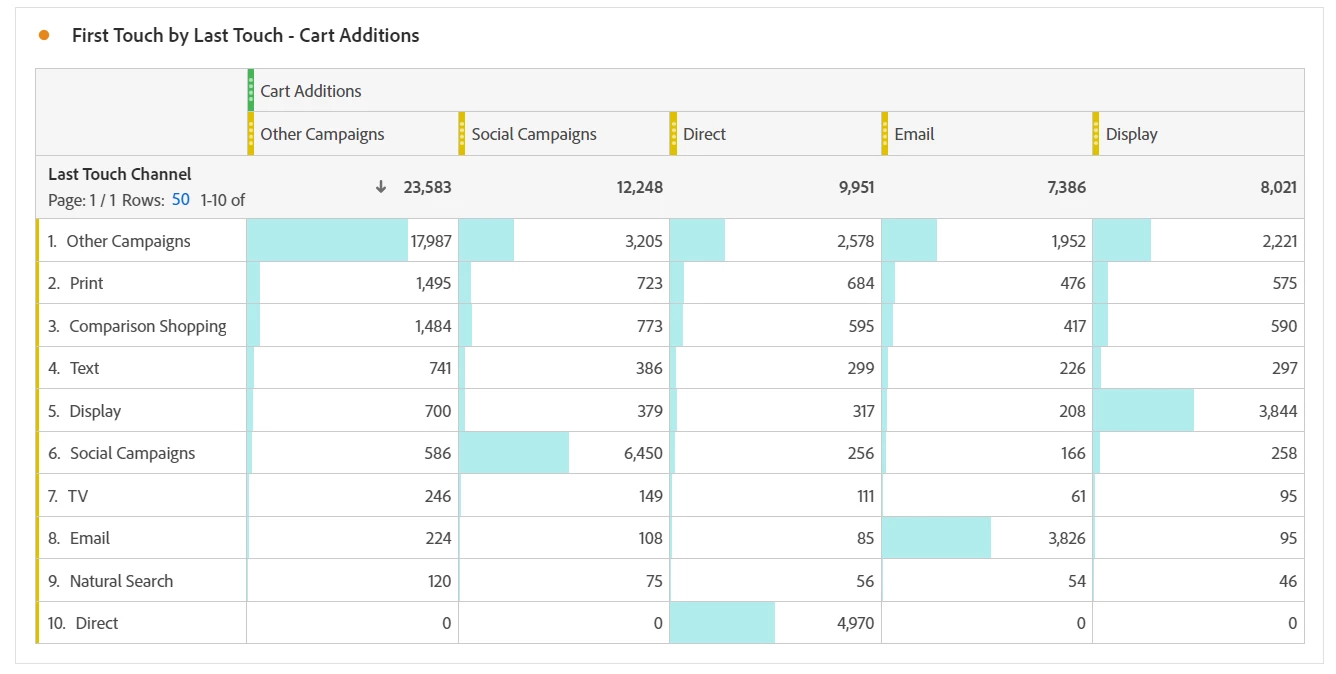
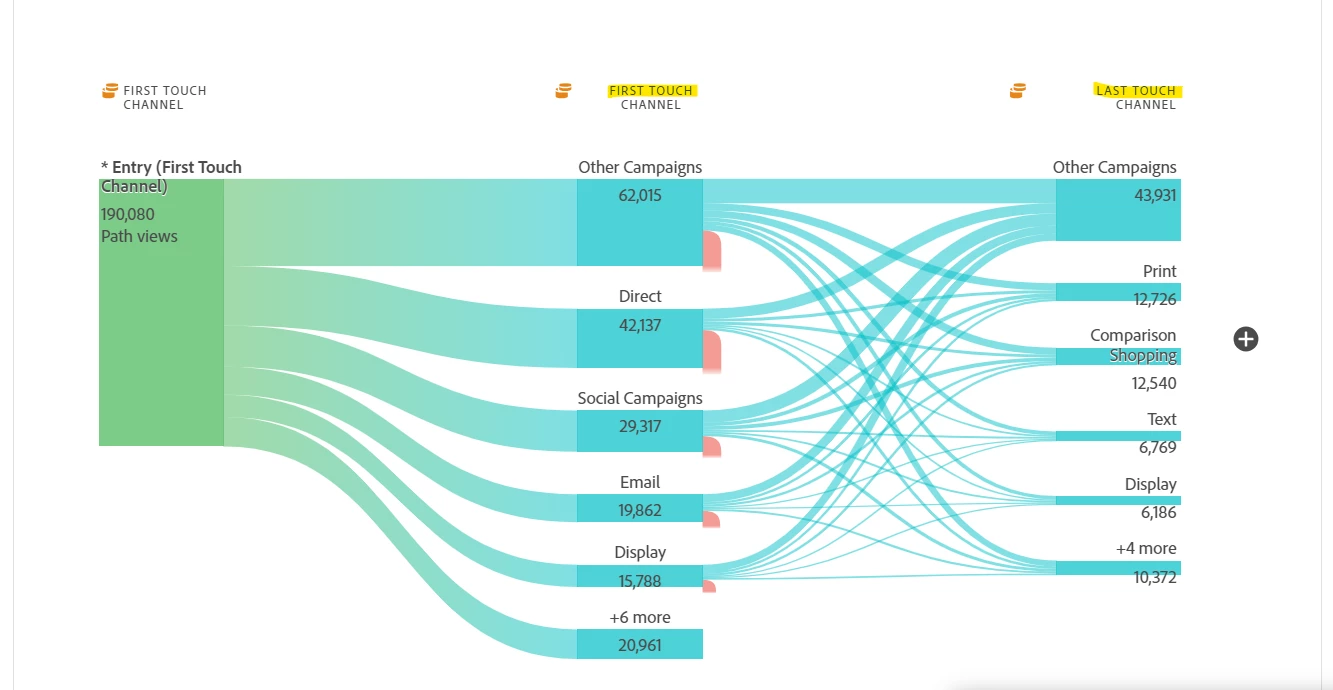
I am trying to know the purchase decision process of the user passing through 1st touch channel  and last touch channel. Example, we might see an ad on a certain platform but convert through another.
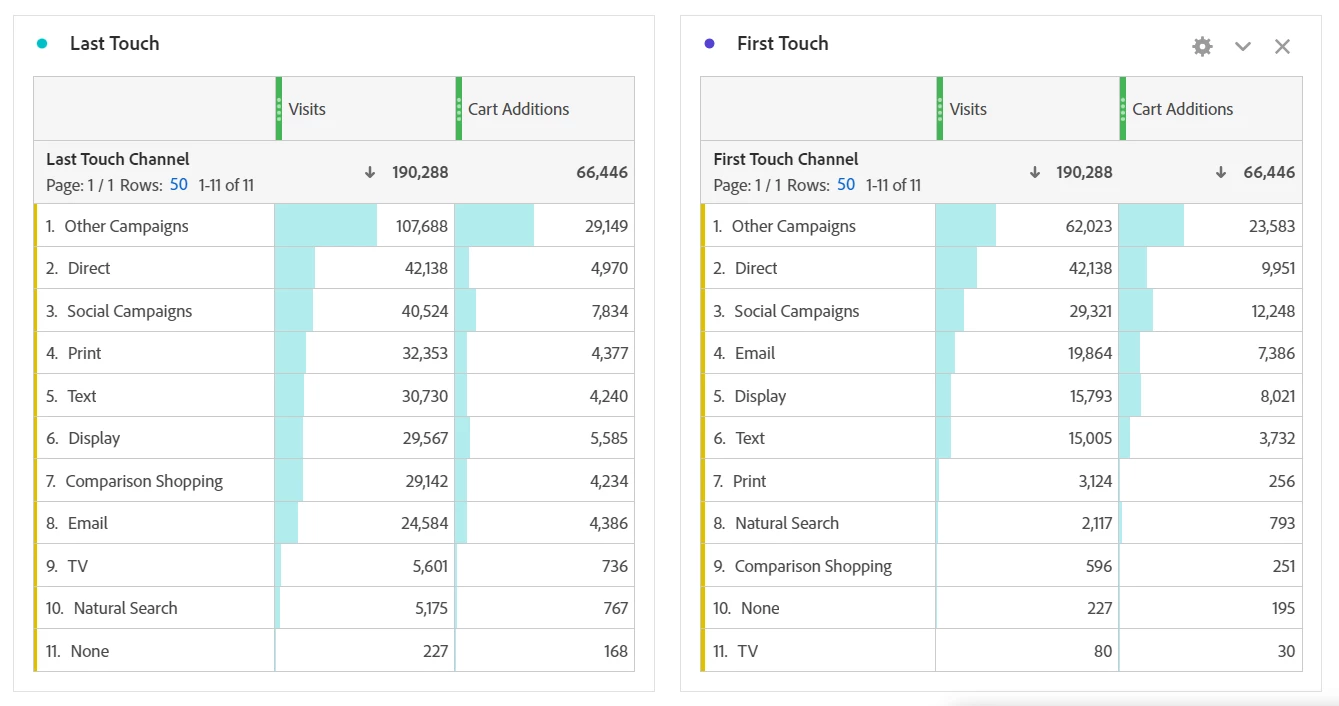
Is there a way to compare first and last touch channel attribution on Adobe in terms of visits and add to carts ?
I tried to create a blank chart with the dimensions of first and last touch channel but i did not find visits as a metric.
Appreciate your feedback.
Thank you 

This post is no longer active and is closed to new replies. Need help? Start a new post to ask your question.
Best answer by Jennifer_Dungan

Hi, I am not sure I understand what kind of comparison you are trying to achieve.. but I can pull up Last Touch Channels and First Touch Channels by Visits and Cart Additions as you asked:


As a sort of comparison, I also did a visualization that looked at the cross between First Touch (along the top, stacked with the metric) and used Last Touch as the breakdown:


I suppose you could also use a Flow chart (Visitor Level) to look at First Touch then moving to Last Touch (repeats on) to see how users are moving between channels like so:


You can build this by starting with First Touch Channel as the "Starts With", then add a column to the flow, then you can drag Last Touch Channel over that new column, replacing the dimension.

1 reply

Jennifer_Dungan
Jennifer_DunganAccepted solution
New Participant
September 11, 2023

Hi, I am not sure I understand what kind of comparison you are trying to achieve.. but I can pull up Last Touch Channels and First Touch Channels by Visits and Cart Additions as you asked:


As a sort of comparison, I also did a visualization that looked at the cross between First Touch (along the top, stacked with the metric) and used Last Touch as the breakdown:


I suppose you could also use a Flow chart (Visitor Level) to look at First Touch then moving to Last Touch (repeats on) to see how users are moving between channels like so:


You can build this by starting with First Touch Channel as the "Starts With", then add a column to the flow, then you can drag Last Touch Channel over that new column, replacing the dimension.