Question
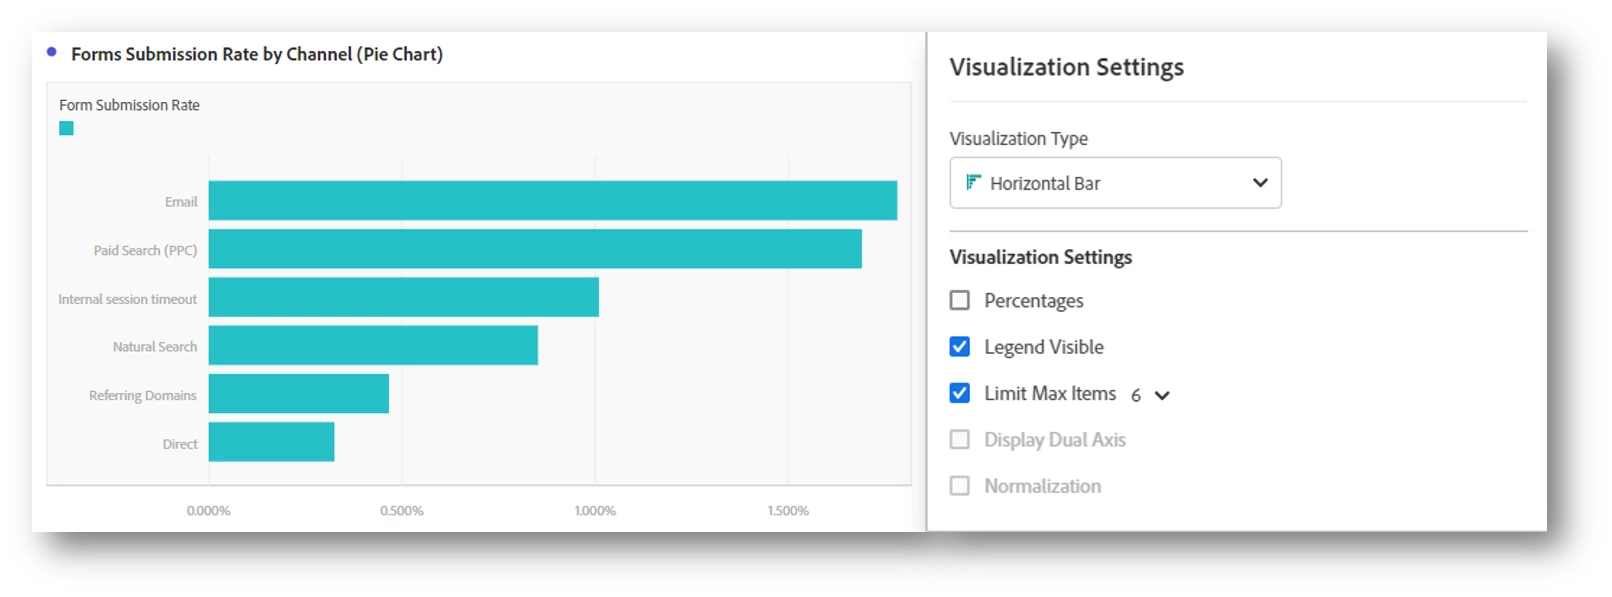
Can't Put labels on Visualizations
I think it's crazy that this hasn't been added to visualizations...
For example, I send PDFs to certain stakeholders and I have to show ugly tables in the PDF because I can't add labels to the Horizontal Bar Chart.