New Participant
December 22, 2017
New

Compare time periods for multiple metrics at once

  • December 22, 2017
  • 6 replies
  • 3628 views

Hi,

Currently the metric for which you want to compare multiple time periods and create the Percent Change metric needs to be in the column header (cfr next screenshot).

As a consequence you'll need to recreate multiple Percent Change metrics.

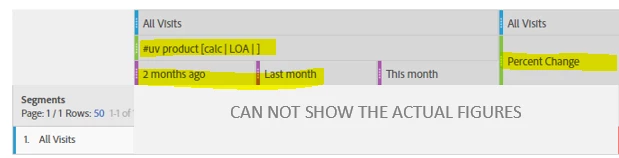
I would like to be able to add just one column 'Percent Change' in the next table:

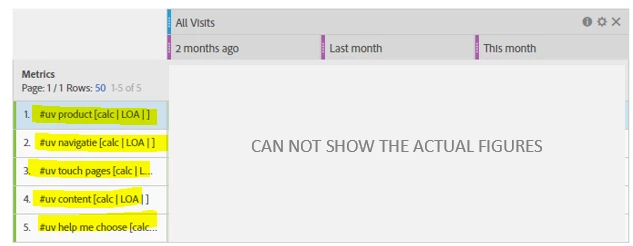
This would save us a lot of time.

Thanks in advance,

Sarah

6 replies

Community Manager
October 5, 2022
No text available
jantzen_b
Employee
October 27, 2020
No text available
New Participant
July 11, 2018

Thanks Urs!

Urs_Boller
New Participant
July 6, 2018

Hi

you can use my workaround which i presented at the adobe summit emea this year:

Workspace project without numbers | Adobe Community

but would love to have an OOB solution.

regards

Urs

New Participant
July 6, 2018

Hi Sarah,

This idea is still needed! In your case the metrics are very similar: you're looking for the number of unique visitors who viewed your 5 different types of pages/do the 5 types of activities.

But when the metrics are completely different- there is no workaround. I'm currently having problems with the table below. The 'compare time periods' option is unavailable.

If you have any inputs for a solution- they'd be much appreciated

BYOIDAuthor
New Participant
December 22, 2017


The idea can be ignored. Instead of creating calculated metrics and putting it left, I should have dragged the (underlying) segments over there,and the metric unique visitors at the top. In that case the Percent Change can be calculated, and I have my desired result.