Create metric on how many unique days visitors has visited during a month | Community
Skip to main content
New Participant
April 27, 2023
Solved

Create metric on how many unique days visitors has visited during a month

  • April 27, 2023
  • 2 replies
  • 913 views

Hi!


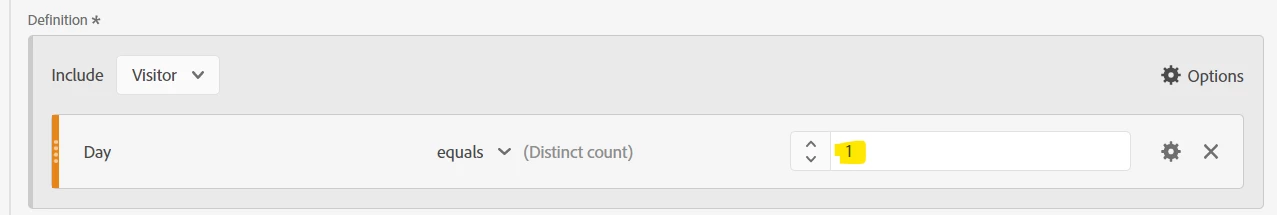
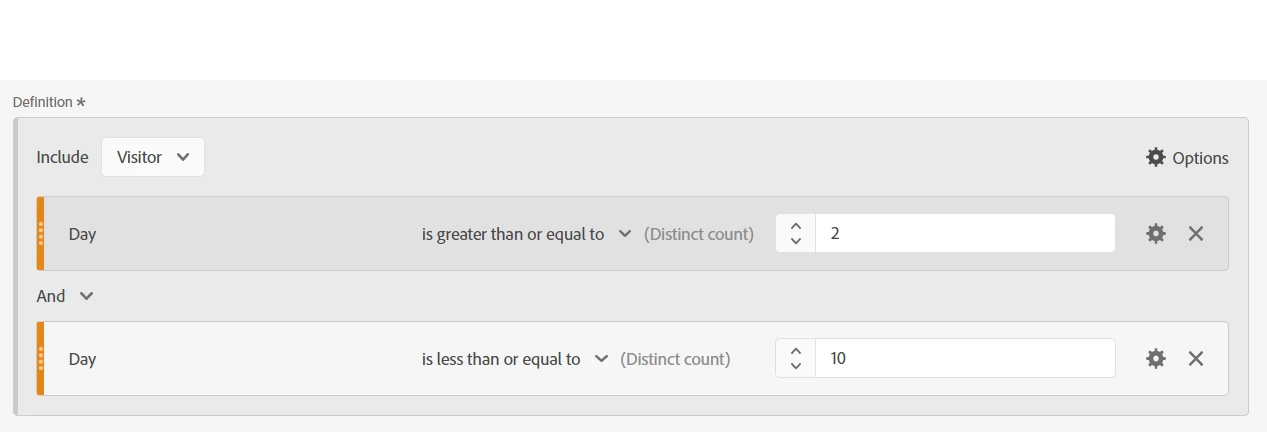
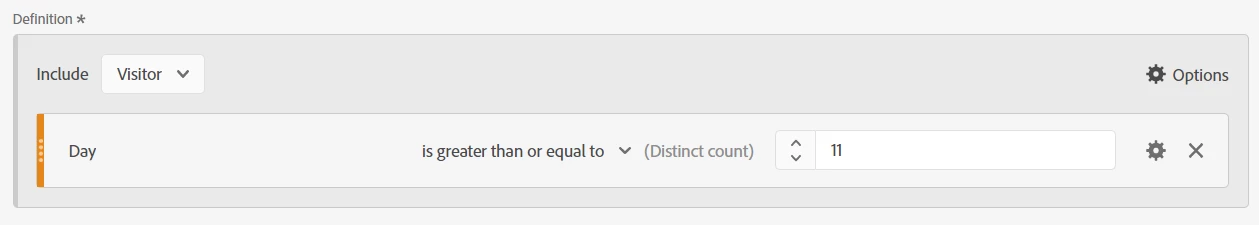
I'm trying to create a metric on how many unique days visitors has visited our site during a month.

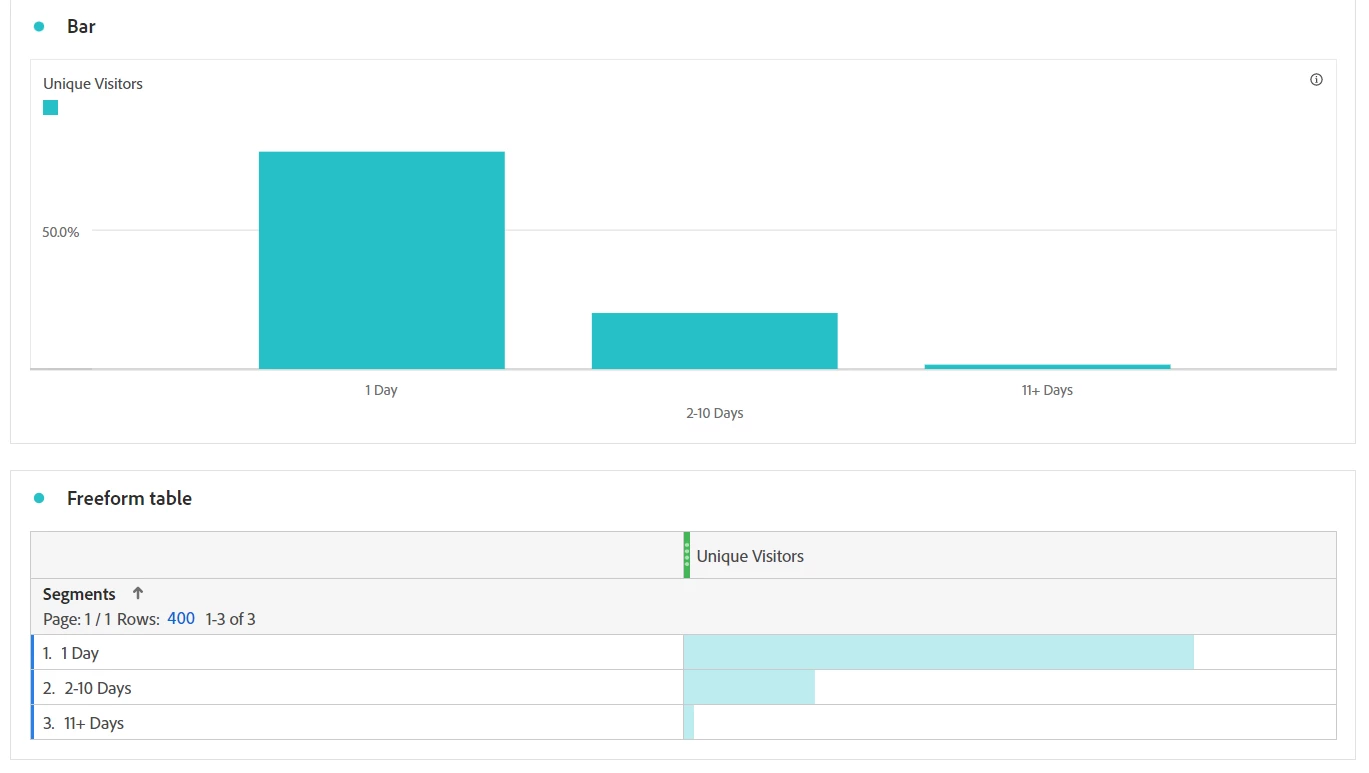
The result should look something like this for example:

20 visitors visited the site 4 days this month

15 visitors visited the site 5 days this month


I am totally lost on this, is there a standard dimension that can be used? I suppose a calculated metric needs to be build, what should be included in that?

This post is no longer active and is closed to new replies. Need help? Start a new post to ask your question.
Best answer by Jennifer_Dungan

Ideally this would be a candidate for a histogram, but at this time Workspace Histograms don't support calculated metrics like "Approximate Distinct Count Days"


But you can fake this!


@sharilynndeutsch  did a great session at Summit this year:
https://business.adobe.com/summit/2023/sessions/skill-exchange-uncovering-optimization-opportuniti-s192.html (I am currently having issues accessing the recording, so I can't give you the timestamp, but I can help explain what she did)


You can create Segments for each number of Days (or Range of Days) by doing this:


(change "1" to the number of days you are looking for... )


Or a Range of Days (Between x and y):


And of course, always end with a catch all of "greater than" after you have created the core segments:


You can use these in a Freeform Table, or graph them as a bar chart (making your own histogram like visualization - you will probably want more than 3 buckets 😉 )


2 replies

New Participant
April 28, 2023

Thank you Jennifer!


Did not think about using segments as dimensions, that made things a lot easier 😅

Jennifer_Dungan
New Participant
April 28, 2023

Glad it helped 🙂

New Participant
June 2, 2023

Hi Jennifer. 


Do you know how we would be able to also add how many of the users who have visited the website during the past year but who haven't visited the website during this current month in the same panel?

Jennifer_Dungan
Jennifer_DunganAccepted solution
New Participant
April 27, 2023

Ideally this would be a candidate for a histogram, but at this time Workspace Histograms don't support calculated metrics like "Approximate Distinct Count Days"


But you can fake this!


@sharilynndeutsch  did a great session at Summit this year:
https://business.adobe.com/summit/2023/sessions/skill-exchange-uncovering-optimization-opportuniti-s192.html (I am currently having issues accessing the recording, so I can't give you the timestamp, but I can help explain what she did)


You can create Segments for each number of Days (or Range of Days) by doing this:


(change "1" to the number of days you are looking for... )


Or a Range of Days (Between x and y):


And of course, always end with a catch all of "greater than" after you have created the core segments:


You can use these in a Freeform Table, or graph them as a bar chart (making your own histogram like visualization - you will probably want more than 3 buckets 😉 )