Creating an index chart | Community
Skip to main content
New Participant
Nov 9, 2018 11:05 AM UTC
Solved

Creating an index chart

Hi, I'm trying to make an index chart based on the percentages from a Freeform table:
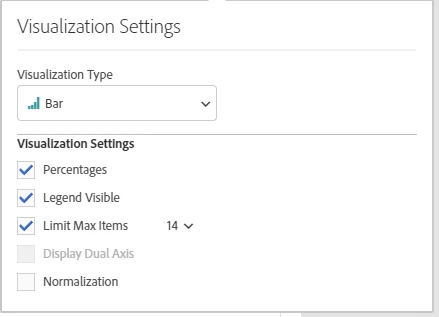
The equivalent in Excel would be a case of just changing the axis value of the y-axis to 1 (or 100%) on the bar graph, and bang, you've got yourself an index chart.  How do you do the same in Adobe Workspace?

Thanks for your help!

This post is no longer active and is closed to new replies. Need help? Start a new post to ask your question.
EricMatisoff
EricMatisoffAccepted solution
Employee
Jan 16, 2019 9:14 PM UTC

I think this is the visualization you are looking for? My apologies if I'm wrong - been a minute since I've bar graphed in Excel

100% Stacked Visualizations in Analysis Workspace - YouTube

2 replies

Gigazelle
Employee
Jan 30, 2019 5:13 PM UTC

Hi Joe, was Eric's answer what you were after?

Translate
EricMatisoff
EricMatisoffAccepted solution
Employee
Jan 16, 2019 9:14 PM UTC

I think this is the visualization you are looking for? My apologies if I'm wrong - been a minute since I've bar graphed in Excel

100% Stacked Visualizations in Analysis Workspace - YouTube

Translate