New
Fix Line Visualisation when freeform table filter overwrites the date range set in the panel
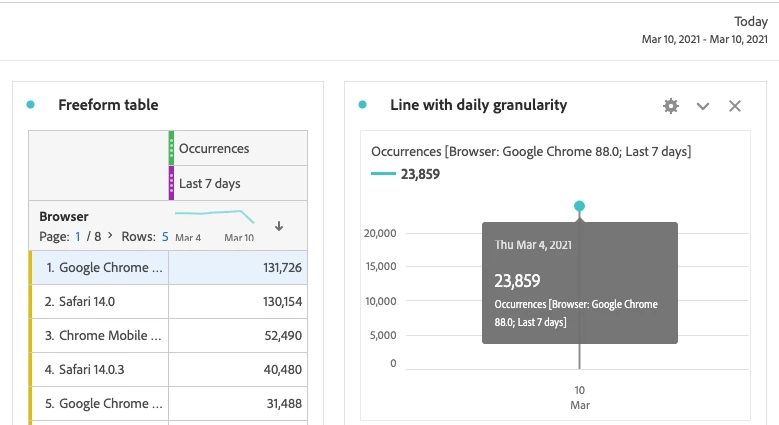
The Line Visualisation fails to correctly show the the trend line if the metric is filtered in the freeform table.
Example:
- The date range in the panel is set to Mar 10
- The metric in the table returns data for the period Mar 4 - Mar 10
- The line visualisation for any table row returns a value for the day the date range in the table filter starts with (Mar 4) and incorrectly indicated the date on the X-axis (Mar 10)
--
Another idea related to the Line Visualisation: Fix chart dates when calendar starts with monday