Issues with reports showing data that does not match filter and segments | Community
Skip to main content
New Participant
July 28, 2023
Solved

Issues with reports showing data that does not match filter and segments

  • July 28, 2023
  • 1 reply
  • 2578 views

Hi, 


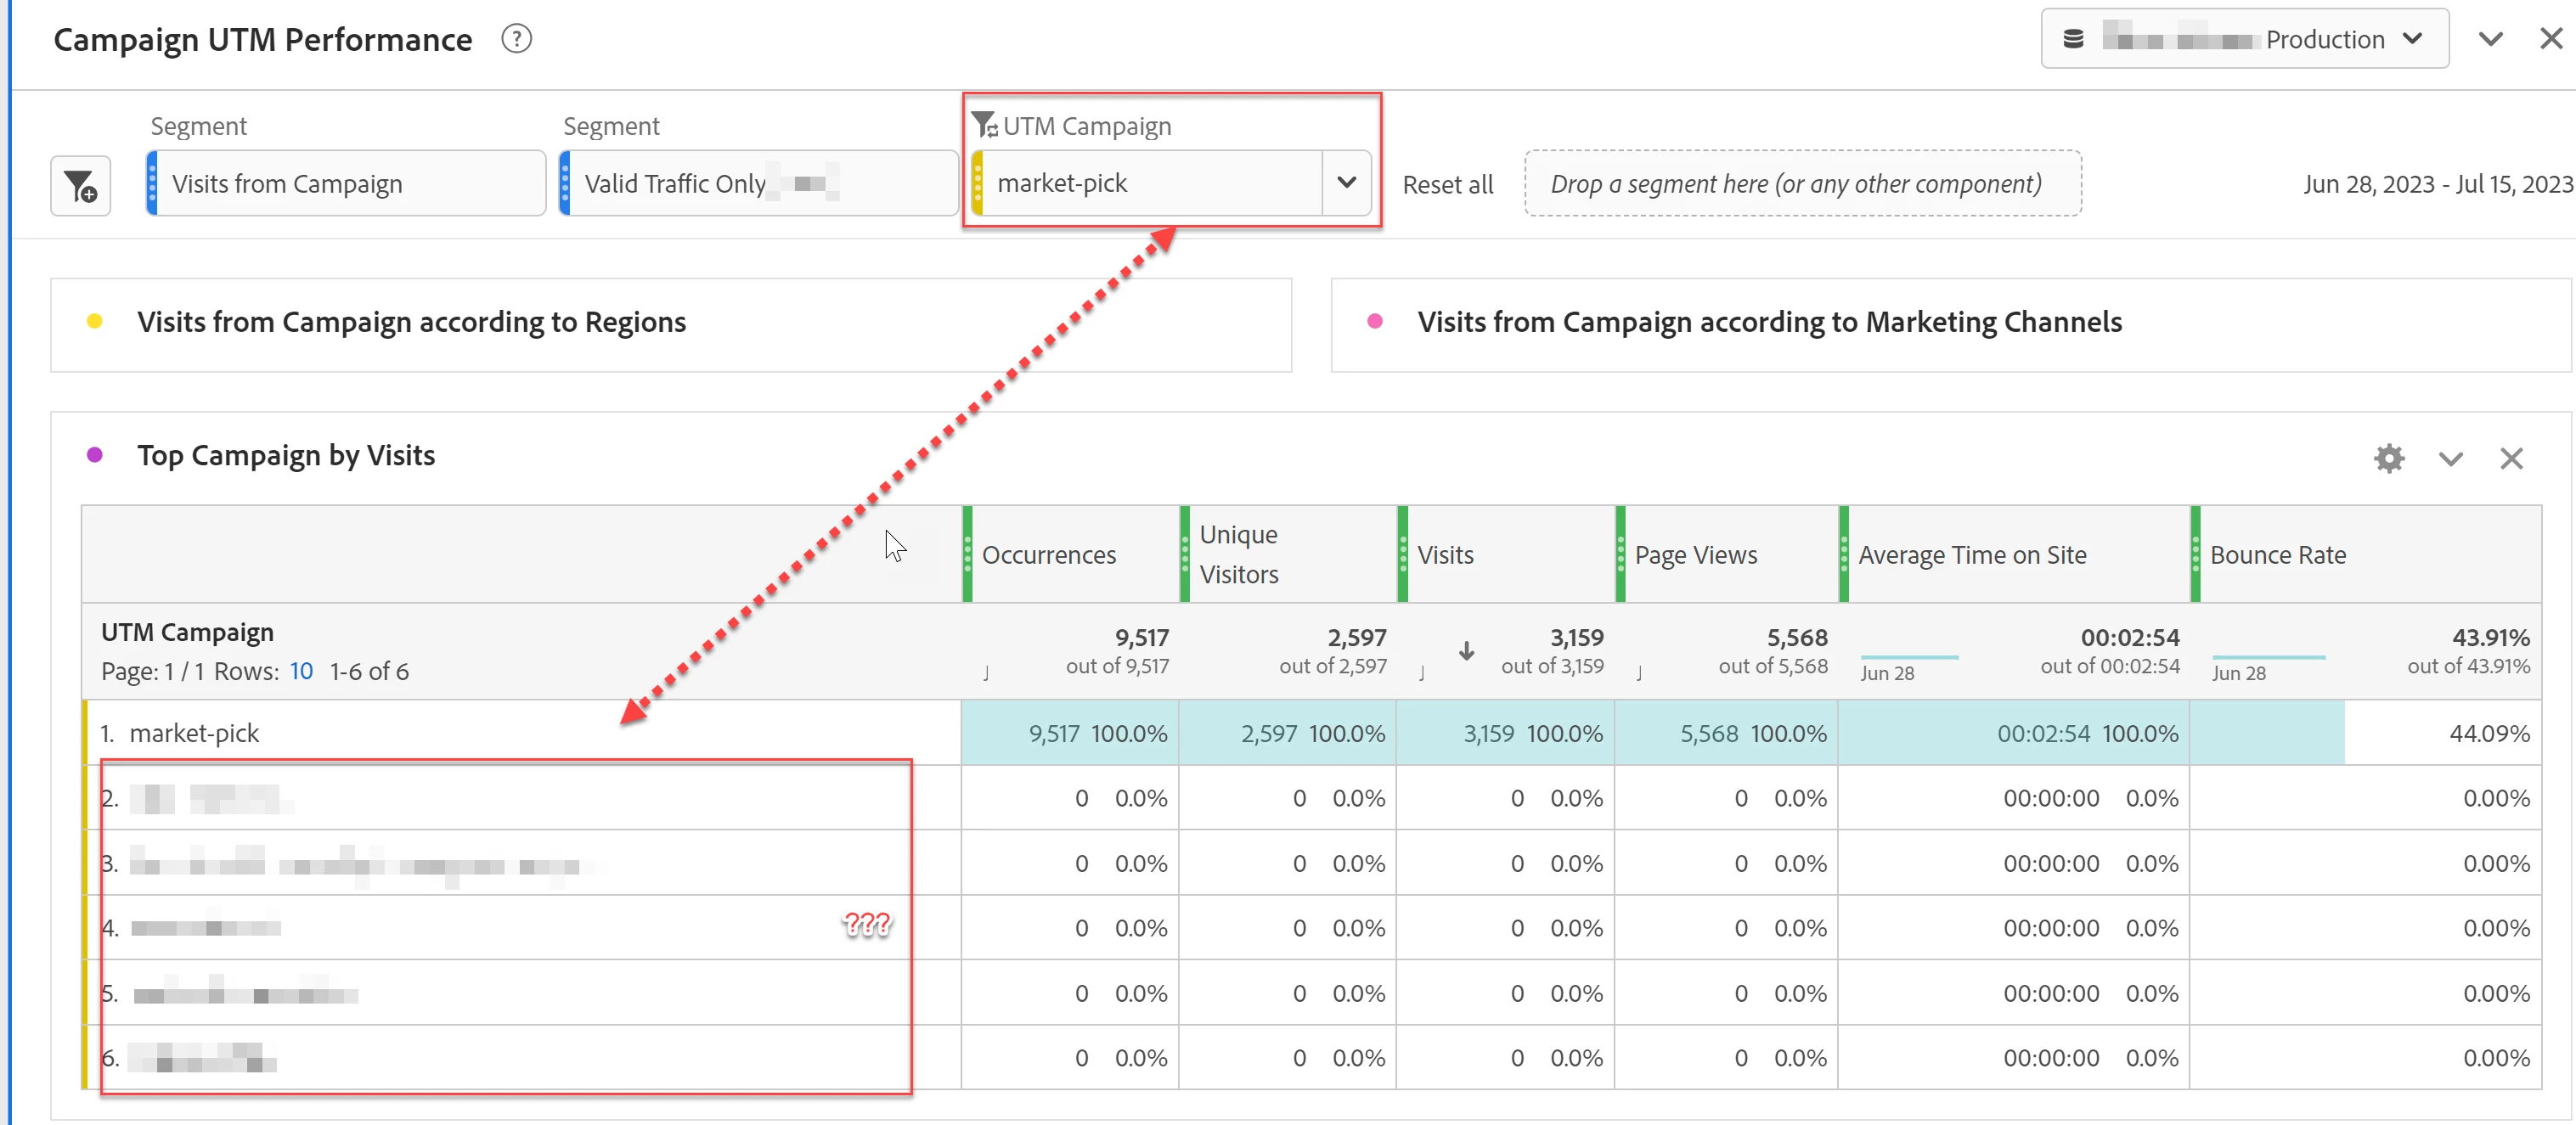
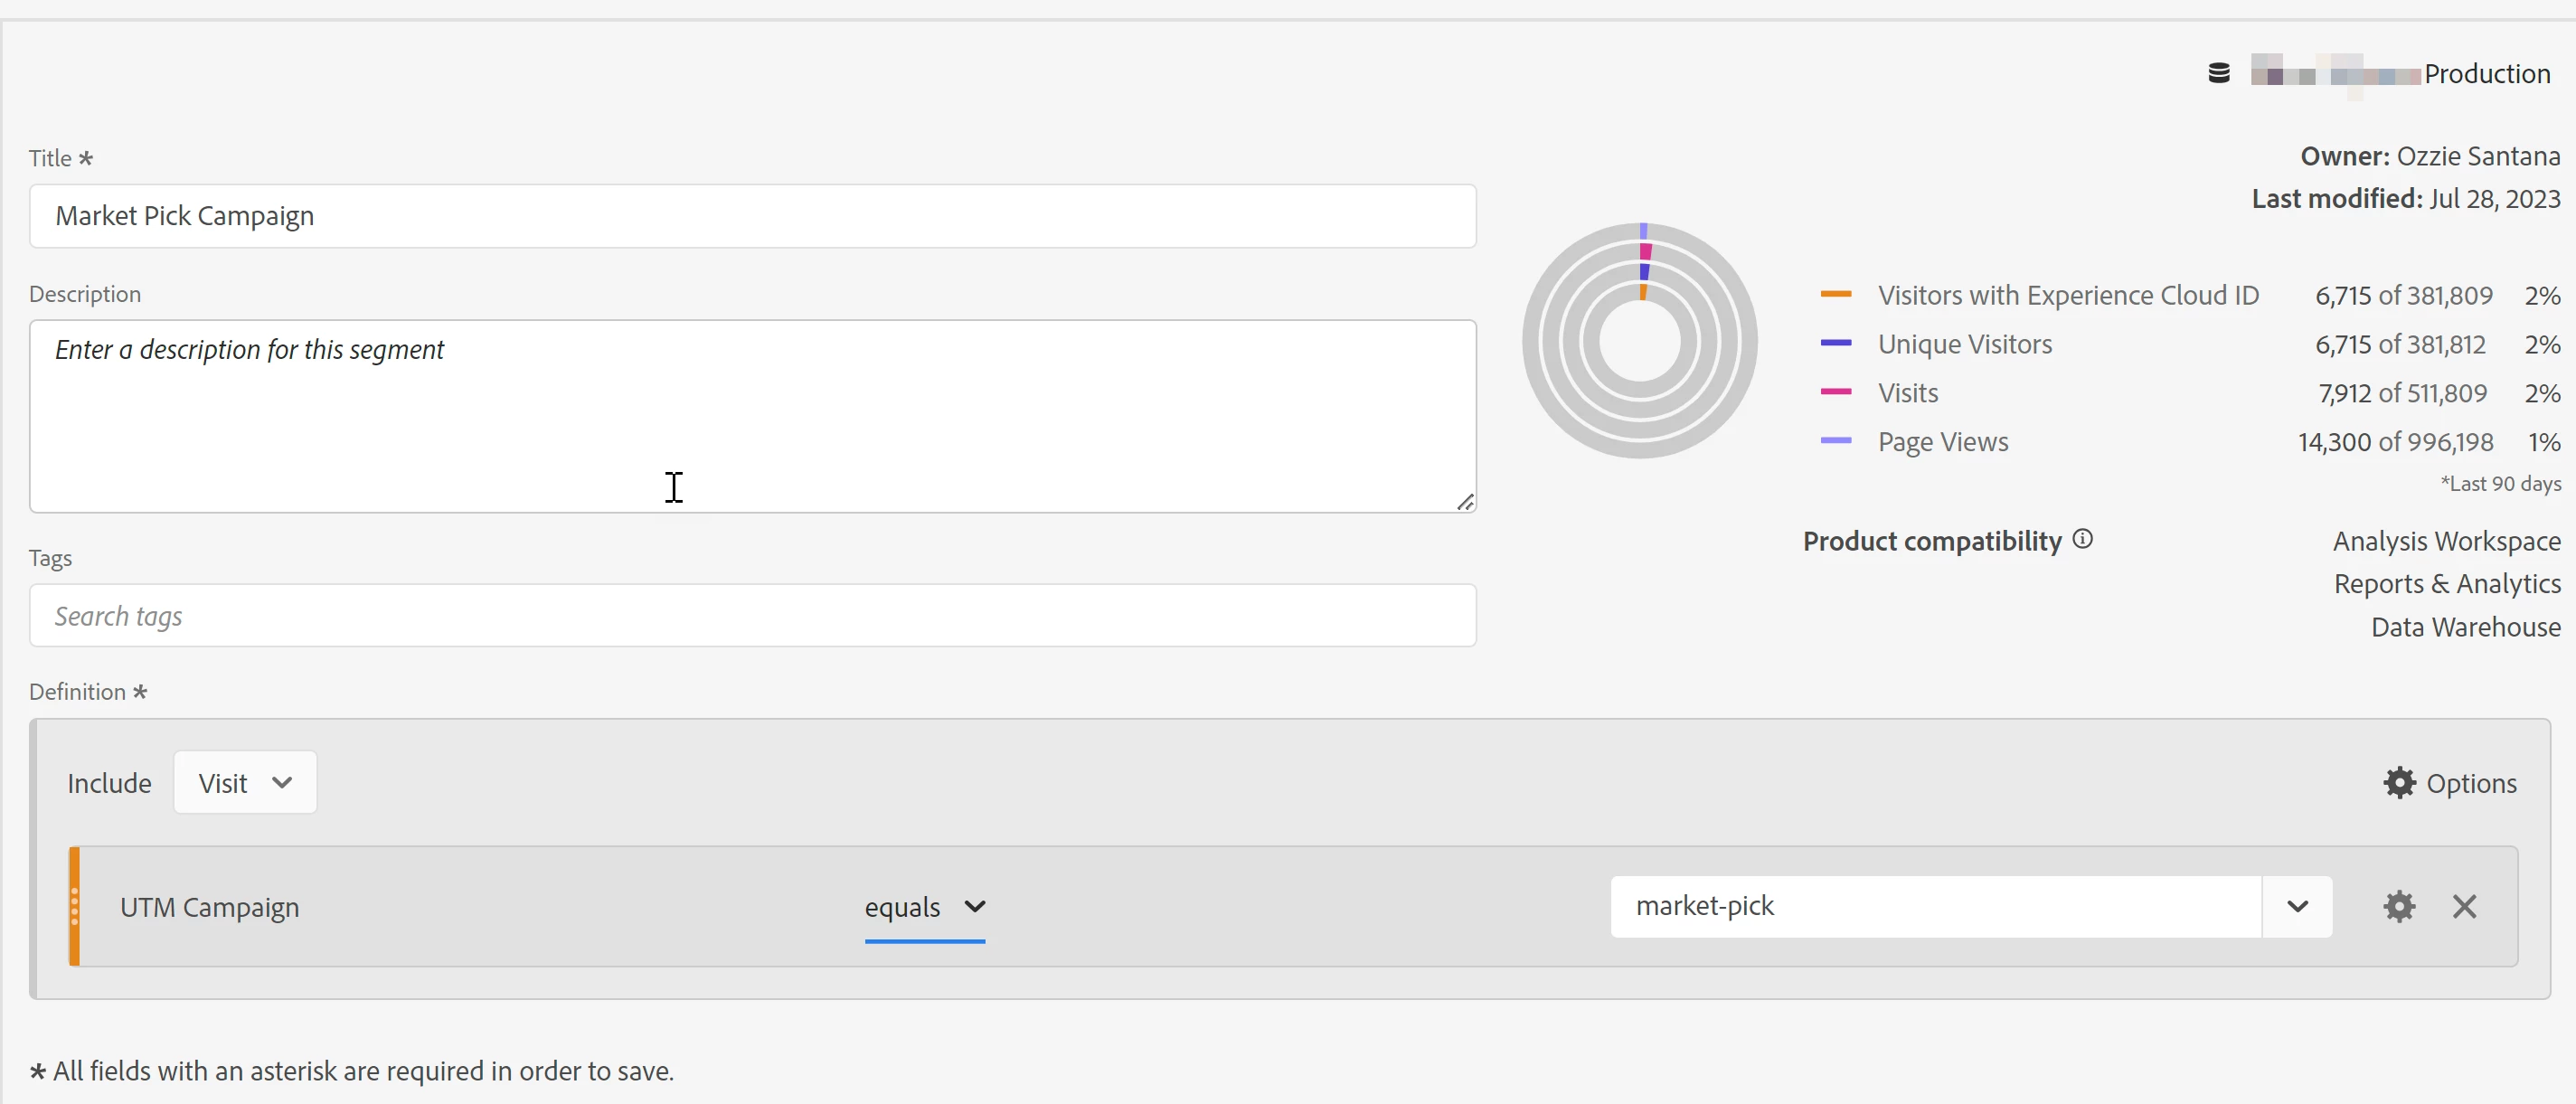
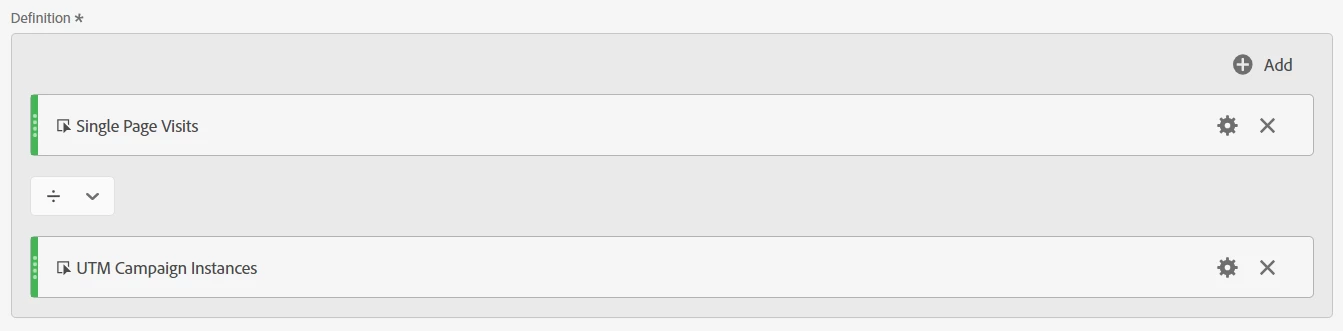
So I'm facing frustration with the Analysis workspace. We've built reports to report on campaign performance on-site. Specifically looking at traffic for a campaign. On one of our panels, we have a dropdown of the dimensions of captured campaigns; however, when selecting a specific campaign, we still see other campaigns populated in the table below instead of just the single value for the selected campaign. Then I decided to build a segment that looks at visits where the campaign equals that specific campaign, yet the result is the same. Then I changed the segment to hit level, and still, the same result occurred. This is especially so, when we're looking at pages visited from the campaign, and some pages show up that don't belong based on the segment (i.e., A table of full URL shows URLs of pages with other campaign parameters appended to it). Why does this happen? I'm so used to GA and Looker Studio, where filters narrow down to the specific item I'm trying to look at; why can't Adobe Analytics do the same? Is there something I'm missing to achieve what I want to see?


This post is no longer active and is closed to new replies. Need help? Start a new post to ask your question.
Best answer by Jennifer_Dungan

Bounce Rate is the culprit.... if you remove that metric, the drop down will work....


The issue is that even with the UTM Campaign filtered, the Entries metric (which is used in the calculation for Bounce Rate) looks at "Entries that have ANY UTM Campaign... allowing those other values to appear (even though the Bounce Rate for the row ends up being 0)


You can create a sort of custom Bounce Rate for this table, by creating a calculated metric for:

Single Page Views / UTM Campaign Instances


(I would call this something like "Campaign Bounce Rate" to ensure that it's clearly a custom calculation)


The values won't match the current Bounce Rate, which is based on Single Hit / Entries.


You won't be looking at Hits, but Pages, and you won't be looking specifically at Entries, but the instance of your Campaign...


But if you frame it this way to the audience, your filters will at least function the way you expect them too.

1 reply

Jennifer_Dungan
Jennifer_DunganAccepted solution
New Participant
July 28, 2023

Bounce Rate is the culprit.... if you remove that metric, the drop down will work....


The issue is that even with the UTM Campaign filtered, the Entries metric (which is used in the calculation for Bounce Rate) looks at "Entries that have ANY UTM Campaign... allowing those other values to appear (even though the Bounce Rate for the row ends up being 0)


You can create a sort of custom Bounce Rate for this table, by creating a calculated metric for:

Single Page Views / UTM Campaign Instances


(I would call this something like "Campaign Bounce Rate" to ensure that it's clearly a custom calculation)


The values won't match the current Bounce Rate, which is based on Single Hit / Entries.


You won't be looking at Hits, but Pages, and you won't be looking specifically at Entries, but the instance of your Campaign...


But if you frame it this way to the audience, your filters will at least function the way you expect them too.

Josh__Stephens
New Participant
July 28, 2023

Those entries and visit-related metrics can be so tricky!  I've banged my head against the wall a few times before I realized what was the cause.

Jennifer_Dungan
New Participant
July 28, 2023

Yeah, it's also the same when I do breakdowns like Weeks or Months... if I have bounce rate added as a column, I always get one extra row outside my panel date range with 0 values.... very annoying 🙂