Percentage change from prior period in freeform table | Community
Skip to main content
philliptrost
New Participant
April 13, 2023
Solved

Percentage change from prior period in freeform table

  • April 13, 2023
  • 3 replies
  • 3214 views

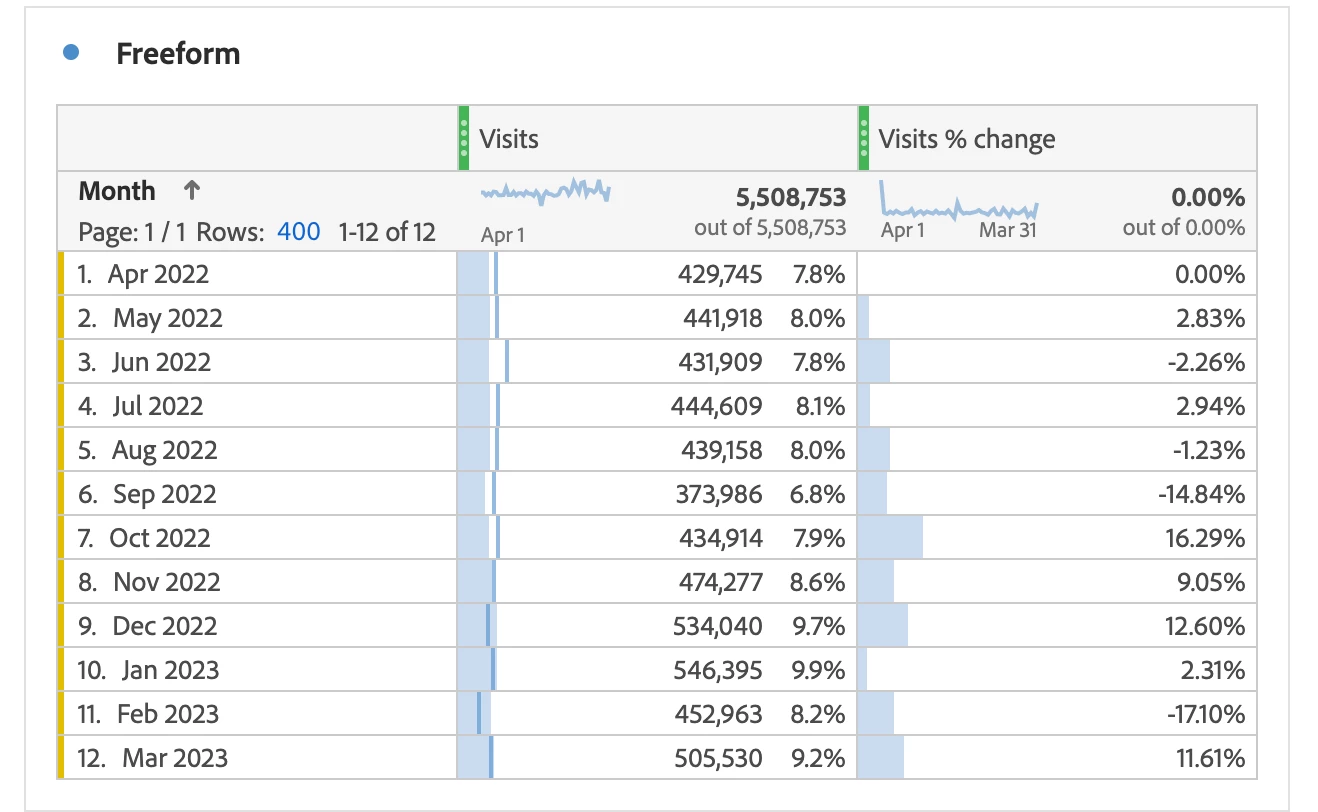
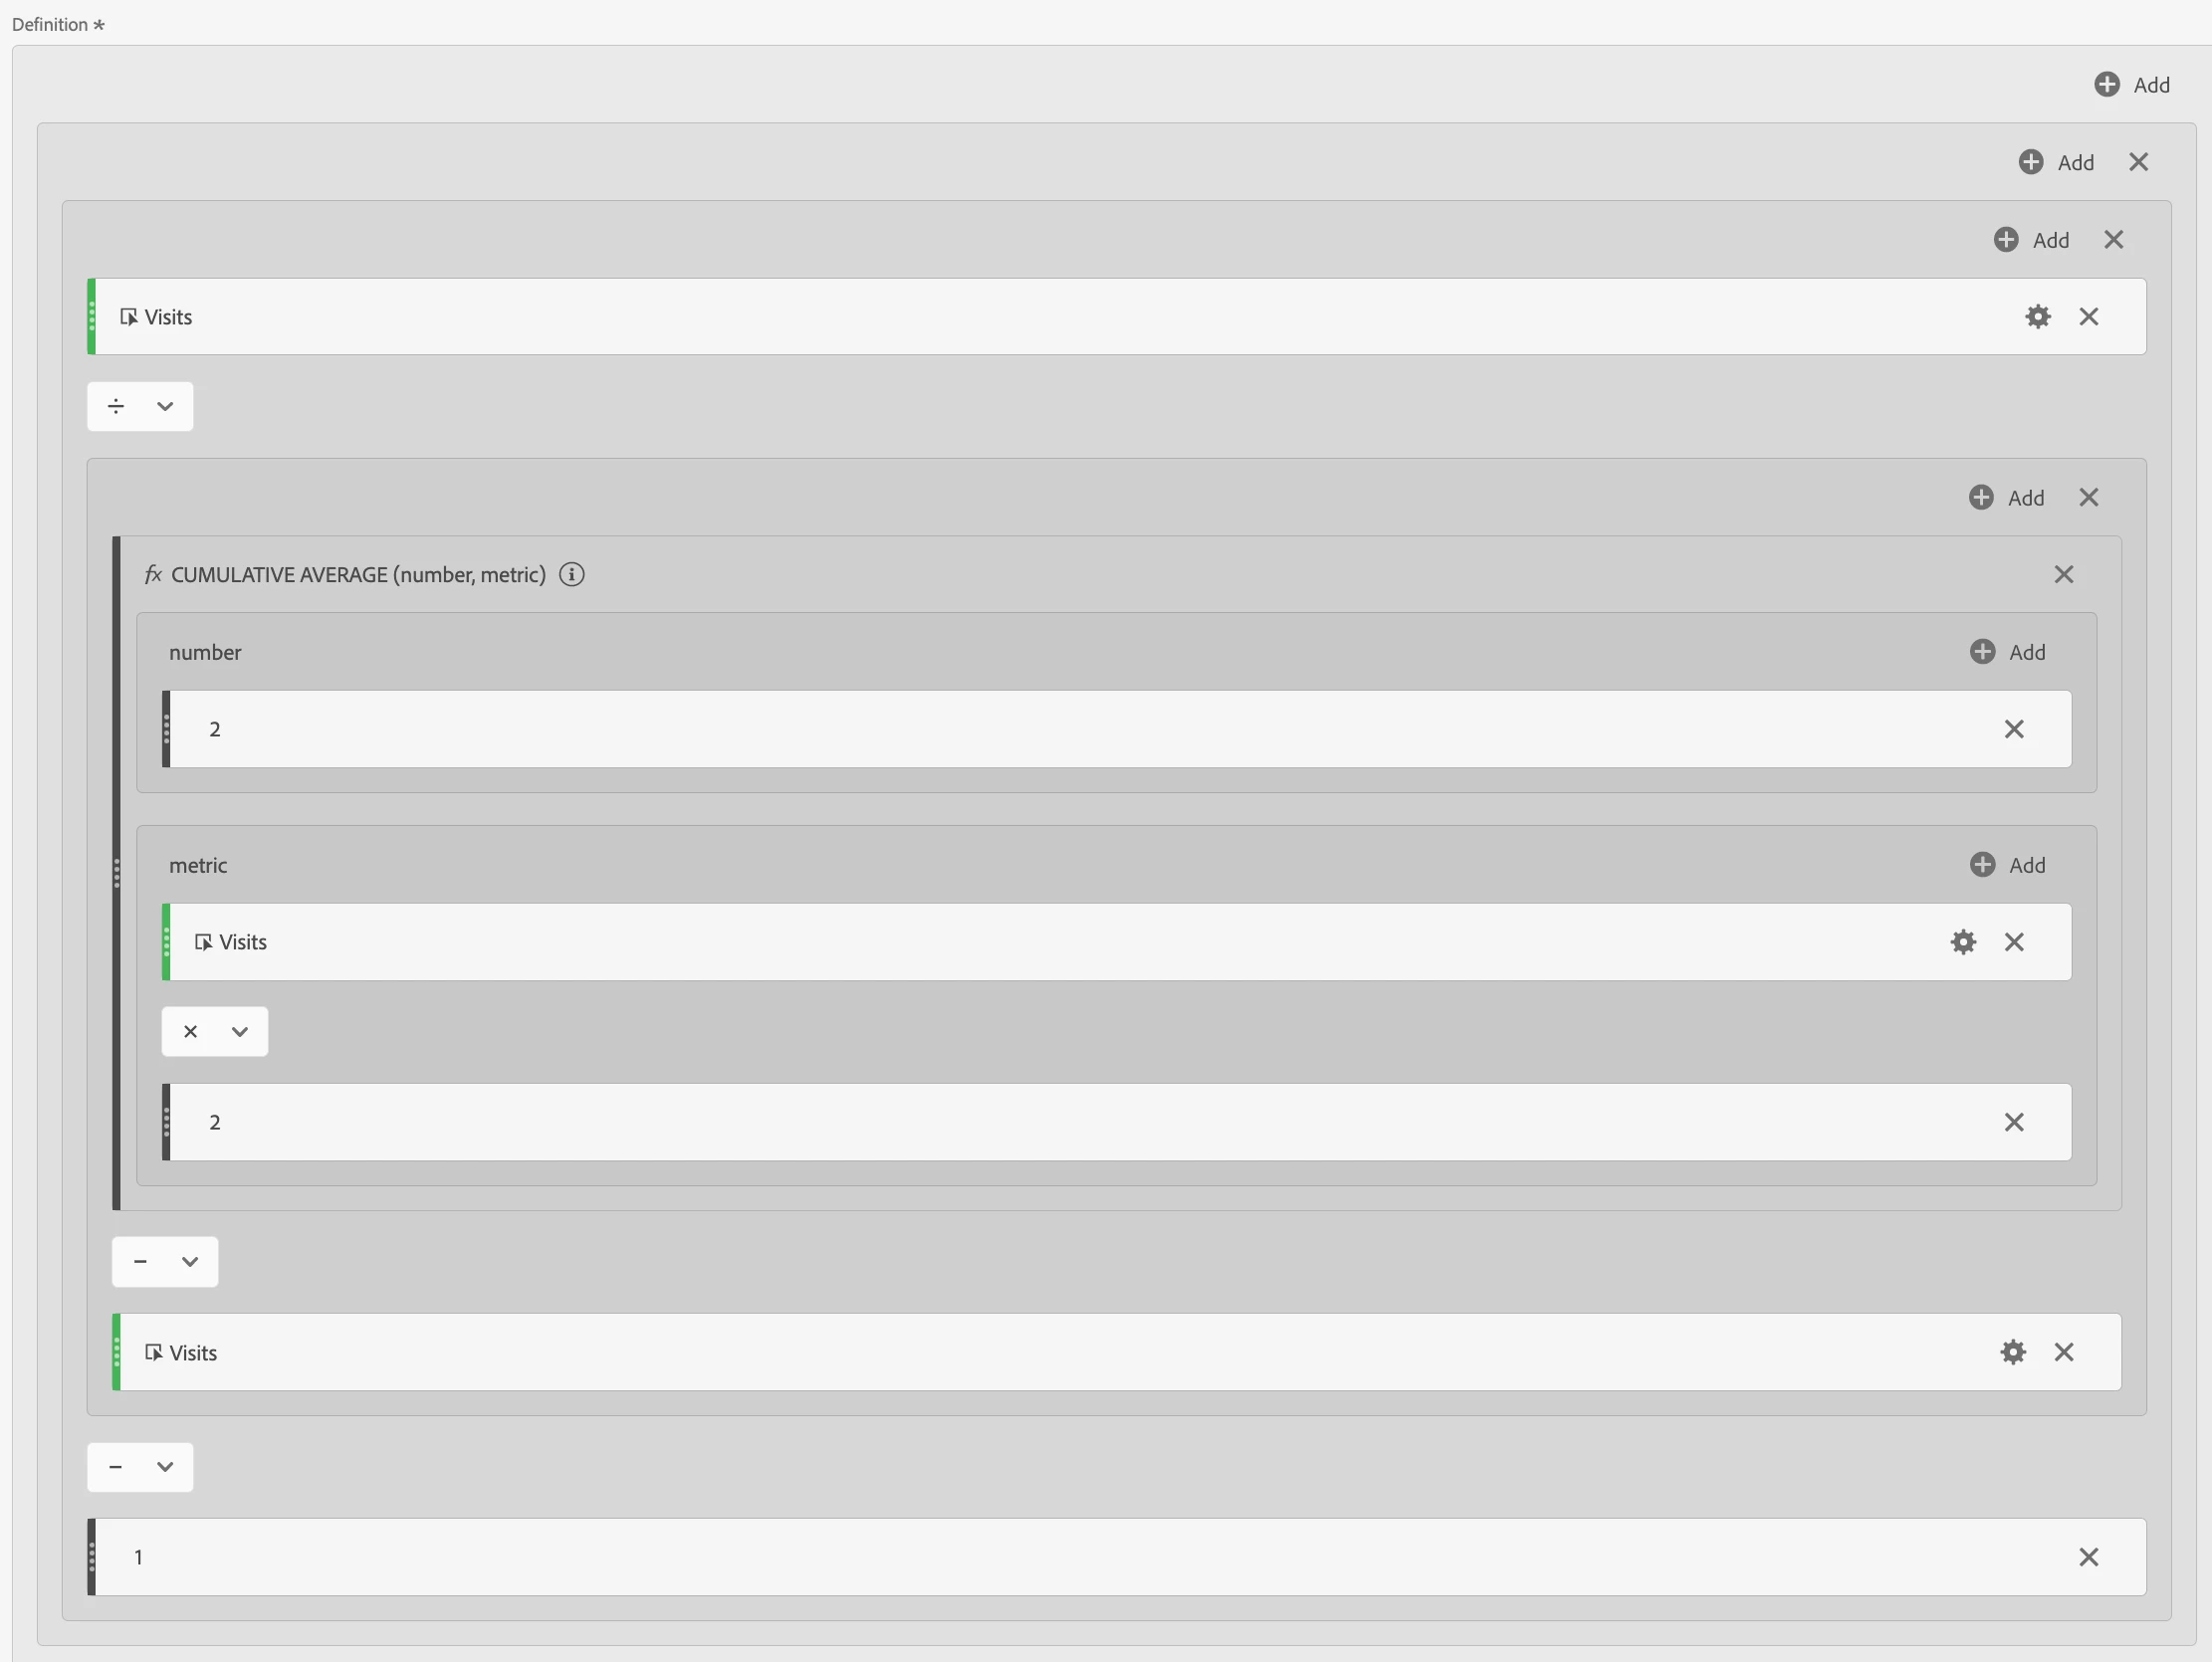
I'd like to build a freeform table that returns the percentage change from the prior period in the table.

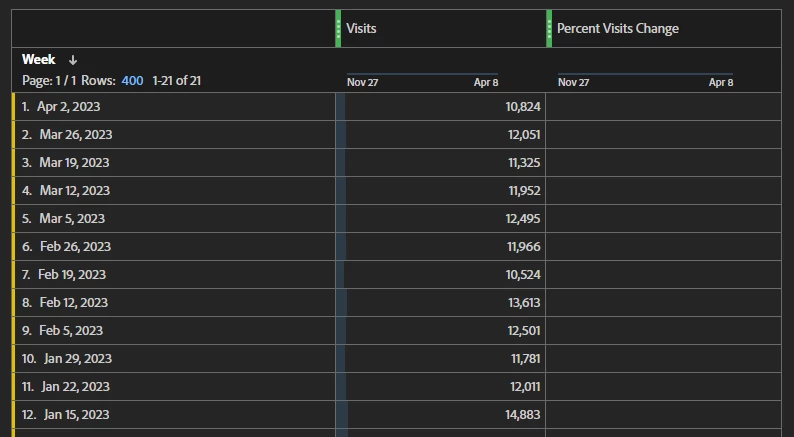
Expected results would be something like my screenshot below that shows the Week period in rows and then the Visits metric as a field. The custom metric would then show the percentage lift or fall from the prior period used (week in this case).

Bonus if I could change the period from Day, Week, or Month and have the metric know this, but having separate metrics for standard date periods is no biggie. Thanks in advance!


BTW - If you utilize ChatGPT to help, don't bother - it hallucinates almost any answer for Adobe Analytics still.

This post is no longer active and is closed to new replies. Need help? Start a new post to ask your question.
Best answer by Josh__Stephens

I was able to get a calculation that works, but definitely requires jumping through more hoops than it should. I'd upvote it as a feature request.


Here's demo data from our Evolytics sandbox with the calculated metric.

Here's the metric definition.  I feel like I've used too many containers but when I tried to refactor, I broke it so it be's what it be's 🙂


3 replies

Josh__Stephens
Josh__StephensAccepted solution
New Participant
April 14, 2023

I was able to get a calculation that works, but definitely requires jumping through more hoops than it should. I'd upvote it as a feature request.


Here's demo data from our Evolytics sandbox with the calculated metric.

Here's the metric definition.  I feel like I've used too many containers but when I tried to refactor, I broke it so it be's what it be's 🙂


philliptrost
New Participant
April 14, 2023

Dude, it worked.
I knew that Cume average would be clutch; it's the same formula I've used for rolling averages. I must have not used enough containers, ha!
I'm going to read a bit more on the function, but I'll be able to apply this in SO MANY ways now.
Great work!

Josh__Stephens
New Participant
April 14, 2023

Awesome, glad it's helpful!

Jennifer_Dungan
New Participant
April 13, 2023

Yeah, I also have used the Percent Change function, but yeah, it really doesn't work for such a table.... Just against dimensions for a single comparison....


I even tried hacking it using "This Week" and "Last Week" designations in the calculated metric and "Make Dates Relative" feature... but no luck....


If I were doing this.. I would probably use Report Builder to pull out data at a set granularity (weekly, or daily, or monthly), then use Excel to calculate the rolling row percent changes.....


I know that's not really the answer you wanted though... but if you post an idea for the ability to make rolling date % change visualization I will absolutely upvote it!

Krishna_Musku
New Participant
April 13, 2023

@philliptrostAtleast, you can get the table you wanted through excel, not in adobe. Just kidding!! But yeah, if you post an idea for rolling % change I will upvote it too.

Krishna_Musku
New Participant
April 13, 2023

I used to compare the time periods and get the percent change. But that's only for one time period to another. Like in the image you mentioned i didn't get it. If someone knows let us know here.