I am assuming you want to see what calls are fired when you interact with the site, rather than the question being about knowing the definitions of the various variables.
I use three different "debugger" tools for this. One is the Experience Platform Debugger, which is a Chrome extension. Another is the debugger under the Chrome developer Tools. My favorite is Fiddler. This is a free, stand alone debugging tool.
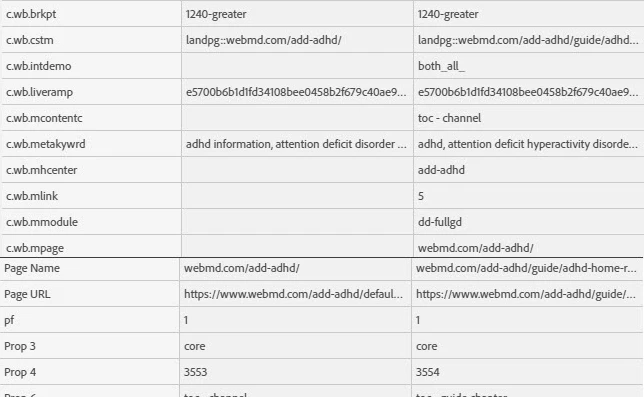
Here is a screenshot of the Adobe debugger (with two calls):
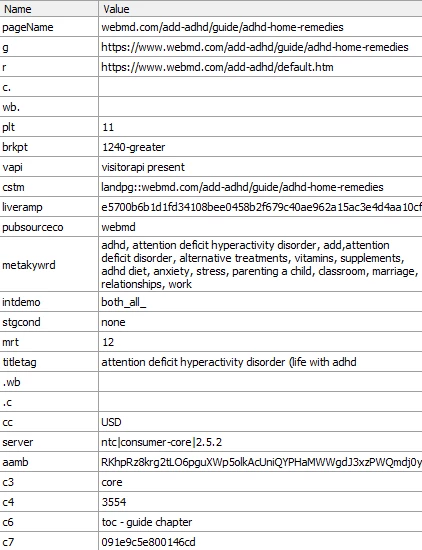
Here is a screenshot of Fiddler:
To get the Adobe debugger:
After you install the Chrome extension or Firefox add-on, an icon is added to the extension bar:
For Fiddler:
- Go to: https://www.telerik.com/fiddler/fiddler-classic
- Click on the “Download” link.
- Fill out the form and download the file.
- Double click and follow the instructions.