In viewing a path report you will see the metric called a "Path View". It counts the number of times a particular path happened.
A path view, in reality, is simply a report table with a segment and a metric applied. Here is the table header underlying a flow from entered on the WebMD home page.
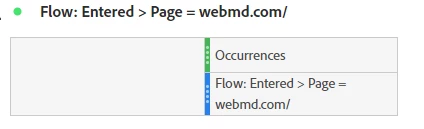
As you can see, Path Views are Occurrence based. However, if you are pathing evars, the evar persistence is removed.
Steps to see this for yourself:
- In the flow visualization, right click a node.
- Select "Trend". This will create a trend visualization.
- In the trend visualization, click the gear icon > Data Source > check the Show Data Source box. This will reveal the table with the segment and metric.
- You can see how segment is build by clicking the "i" in the segment name.
