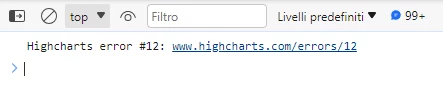
Highcharts error #12 on Custom Report
Hi everyone,
I created a simple report that shows an area diagram and a Pareto distribution on the number of overtures clic;
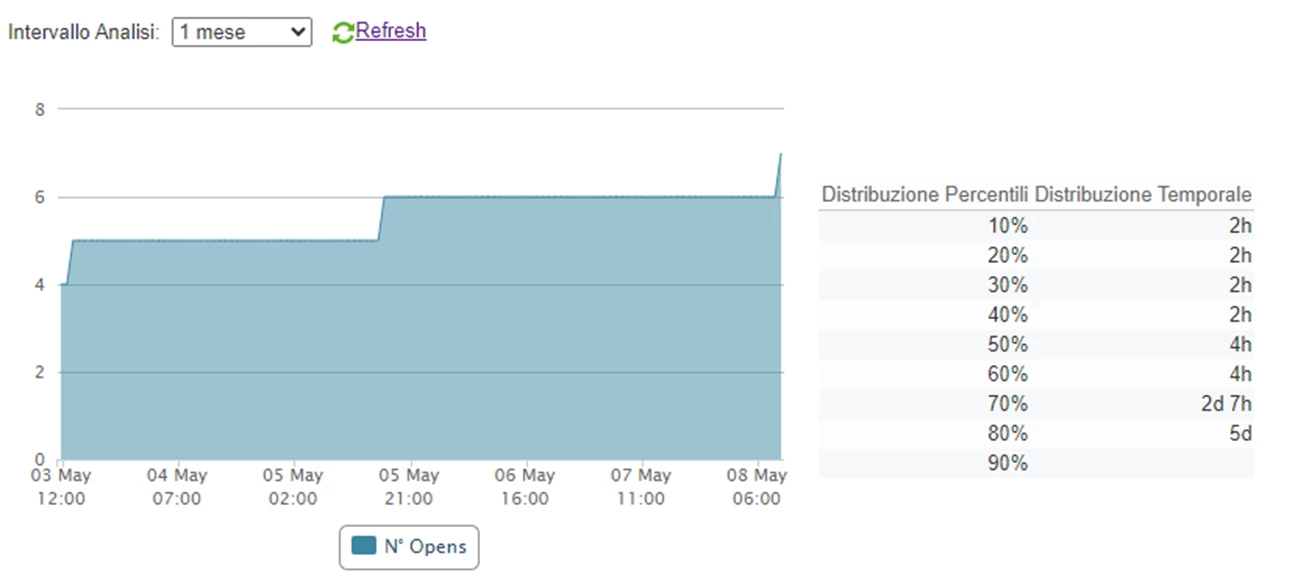
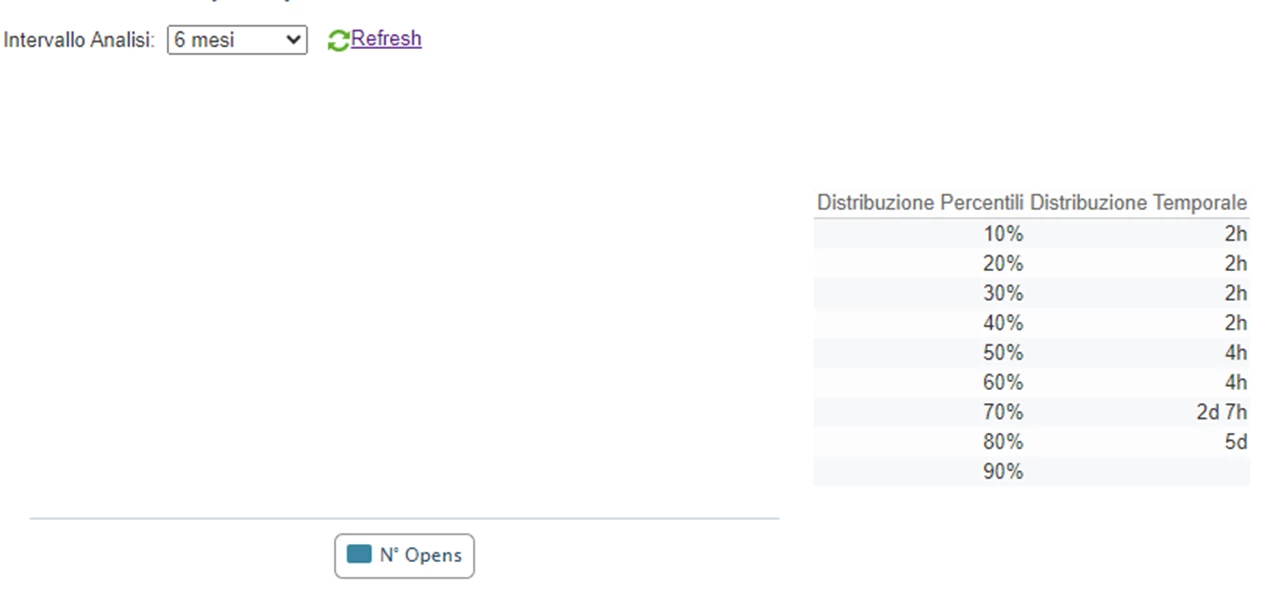
it works very well when I request data in a limited range (up to 3 months) but it fails if I extend the range beyond this limit (even if the amount of data is small):
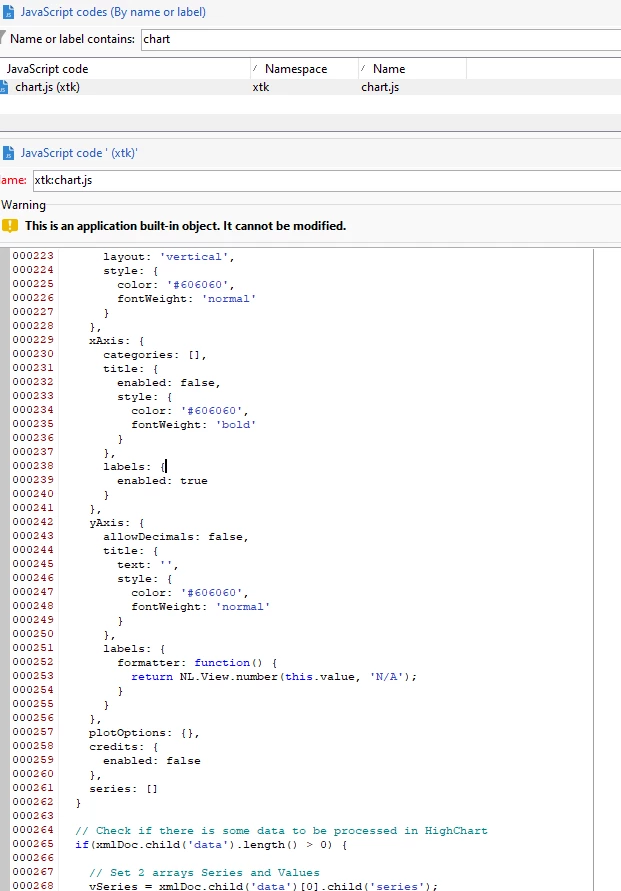
Following the link in the error message, it tells me to configure the plotOptions.series.turboThreshold option of the JS Api of this library, which however I don't know how to access programmatically, given that it is embedded in the Campaign visual composer:
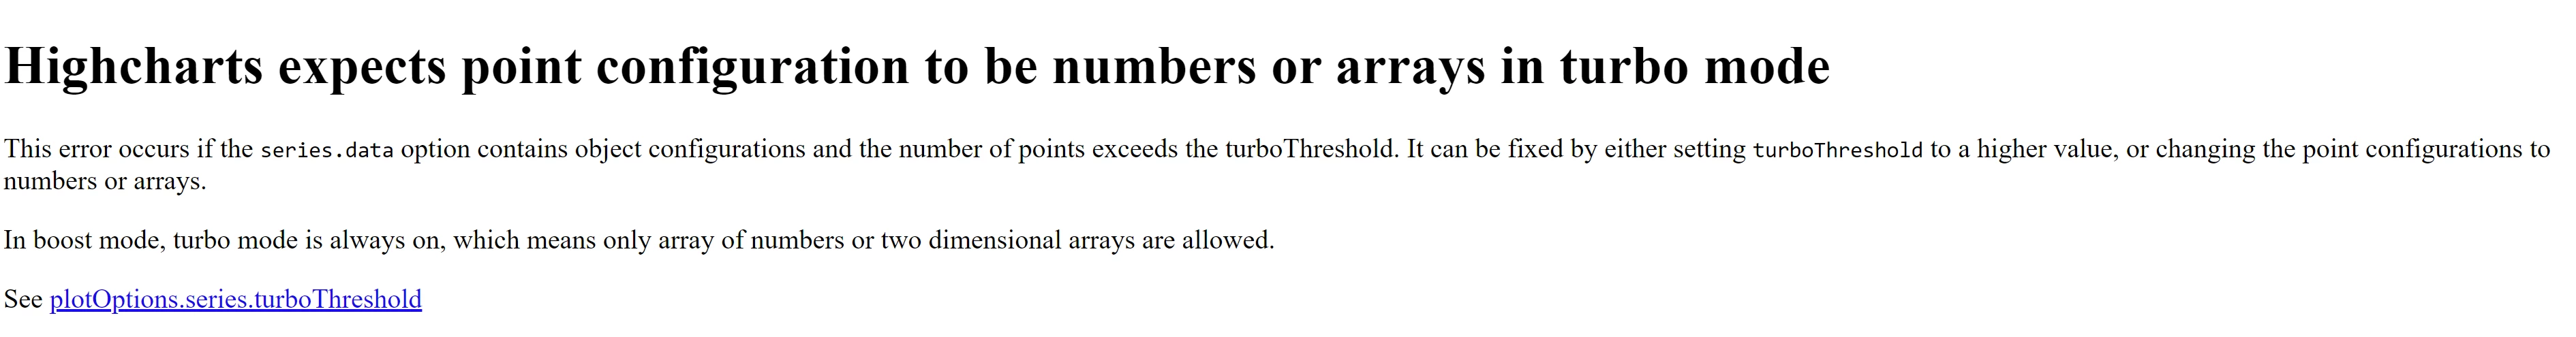
Can you tell me how I can change this behavior to allow data ranges of up to one year?
And, outside this context, what are the data objects to use to create report on:
1) distinct clicks (which ignore the opening by the same email client/recipient);
2) clicks count on tracked URLs?
Thanks in advance, regards