Solved
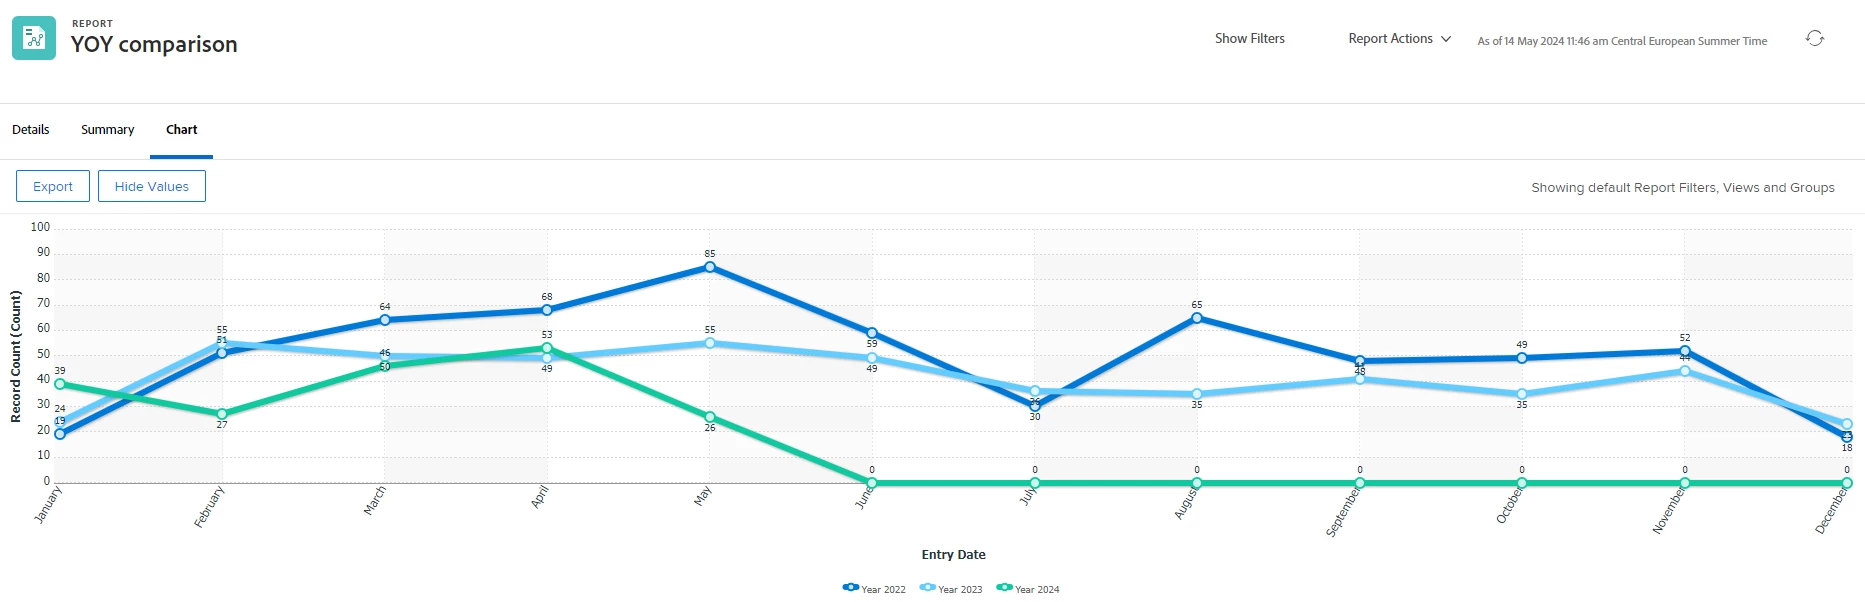
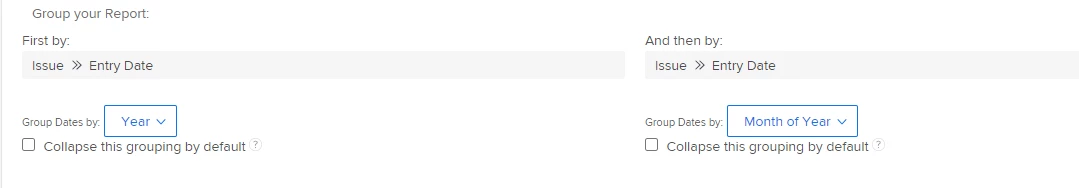
Create a comparative line chart report
I would like to create one line chart report on the number of requests submitted 2023 vs 2024. I am struggling how to get the second line on the line chart.
Has anyone been able to achieve something like this?
Thank you!