Create Chart/Report for Average Requests Completed by Resource by Week and Month | Community
Skip to main content
Level 2
Jun 22, 2021 2:46 AM UTC
Solved

Create Chart/Report for Average Requests Completed by Resource by Week and Month

How would I create a chart/report with the average requests completed by resource (Assigned To) by week and month?

This post is no longer active and is closed to new replies. Need help? Start a new post to ask your question.
William--
William--Accepted solution
New Participant
Aug 11, 2021 3:47 PM UTC

Hi David, sorry I didn't see this the first time!

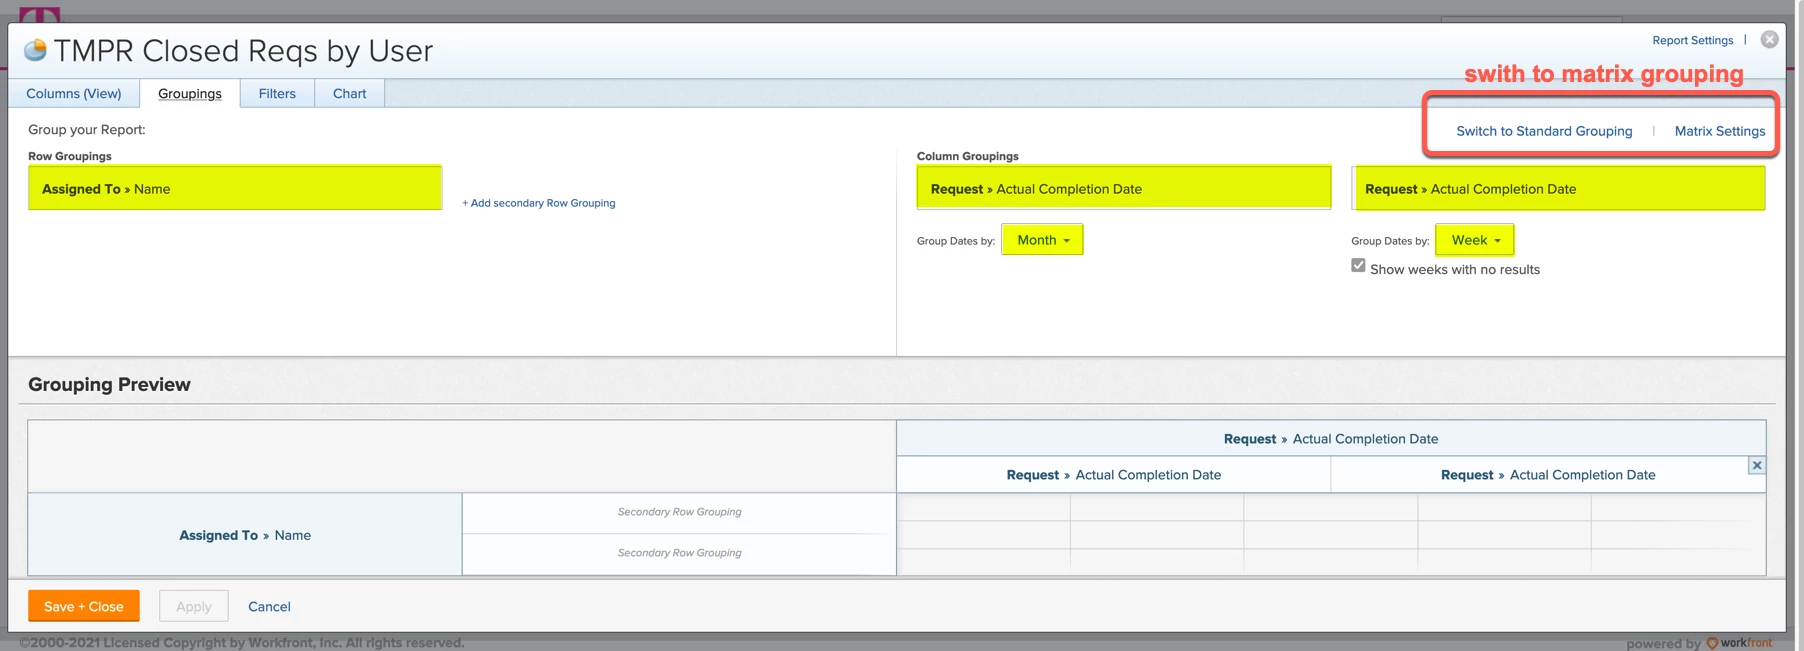
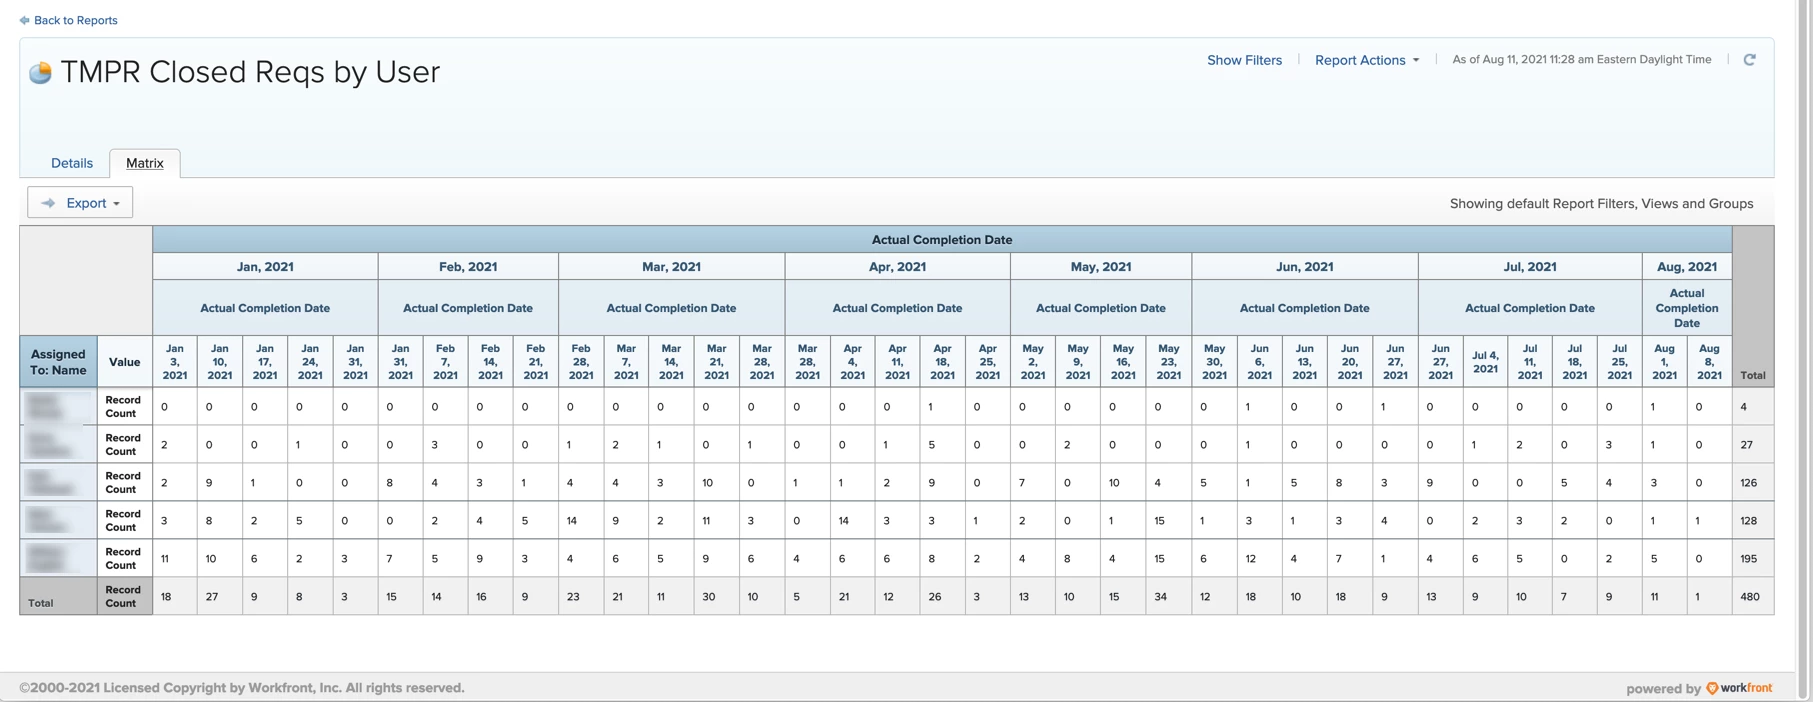
I think you want a matrix report. In your request report, switch to matrix grouping for a tabular view that shows record counts by month and week. You can export the matrix to Excel if you need to perform additional calculations.

In some cases (multiple users assigned to the same request, or wanting a combination of completed tasks and requests), you might consider doing this on an Assignment report instead of a Request report.

If you like my content, please take a moment to view and vote on my Idea Requests: https://tinyurl.com/4rbpr7hf

2 replies

William--
William--Accepted solution
New Participant
Aug 11, 2021 3:47 PM UTC

Hi David, sorry I didn't see this the first time!

I think you want a matrix report. In your request report, switch to matrix grouping for a tabular view that shows record counts by month and week. You can export the matrix to Excel if you need to perform additional calculations.

In some cases (multiple users assigned to the same request, or wanting a combination of completed tasks and requests), you might consider doing this on an Assignment report instead of a Request report.

Translate
If you like my content, please take a moment to view and vote on my Idea Requests: https://tinyurl.com/4rbpr7hf
Level 2
Aug 10, 2021 8:25 PM UTC

I'm looking to do something similar to this as well. I know @Doug Den Hoed‚ has suggested text mode calculations in other threads.

Translate