Level 6
August 13, 2018
Question

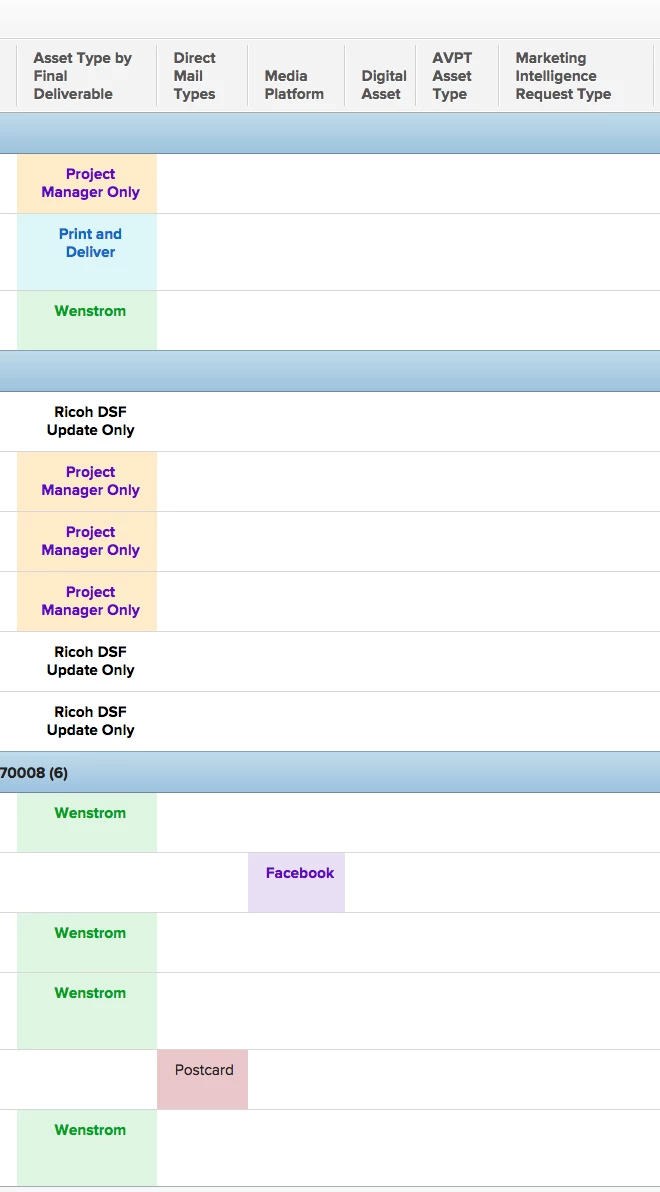
merging custom field from 5 different reports into a single column view

  • August 13, 2018
  • 14 replies
  • 1837 views

Hello All,

I have created a custom dash/report so marketing can see all their project assets in one view.

Because they need to submit a different form for print, signage, digital, social media and avpt etc...I have to show a sep column view for each one.

is there a way to combine them all into a single asset column??

this wasn't as important before but now we are using a single project for campaigns and this would be less cluttered with a single column.
This post is no longer active and is closed to new replies. Need help? Start a new post to ask your question.

14 replies

Level 7
August 14, 2018
If you use a different custom form on each request & project type you could bring that value into the reporting without using text mode. Add the category name from the project and then group by that field. That should chart pretty easy without the use of text mode. Michael Lebowitz GuideWell Connect
Level 9
August 14, 2018
Hi Heather, unfortunately you come across everyone's pain - as soon as you use text mode syntax within columns/grouping, you cannot not pull those tailored information. Text mode sadly doesn't work within charts :( Dagmara Garwell BAKKAVOR LTD
Level 2
August 13, 2018

If I can interject into this thread, it is great that you just posted this because I was looking for this exact thing and your tips worked perfectly. To take this one step further, I need to show my executive team a chart that shows the number of the various assets we create (Print, Digital, Video). In my ideal world, I would be able to show all three value types on one chart... right now I can only show the Print assets, OR the Digital, OR the Video. (Each of these are separate request types in our system). This is probably Reporting 101, but I have no clue how to do it and I've been in Workfront for over a year now!

So I need to show graphically what the combined columns show in the report. Is this possible?

Thank you!

Level 9
August 13, 2018

use a sharecole option. Start with the first column and do it for evey single one you want to see within the first column.

Switch the columns to text mode and type:

sharecol=true

Also if you want to still see the heading follow below steps:

1) in between each column put a clear column

2) Starting right to the left, you go into columns and

- for columns not blank, you just need to add sharecol=true

- for the blank ones - use the code below:

Displayname= COLUMN NAME HERE

sharecol=true

textmode=true

value=<br><br><b>TITLE OF FIELD HERE:&nbsp;</b>

valueformat=HTML

results will looks like on the pic below. Obliviously will have more heading if you use more columns:)

Hope that makes sense:)