New Participant
August 31, 2022
Question

Request Report Chart

  • August 31, 2022
  • 3 replies
  • 779 views

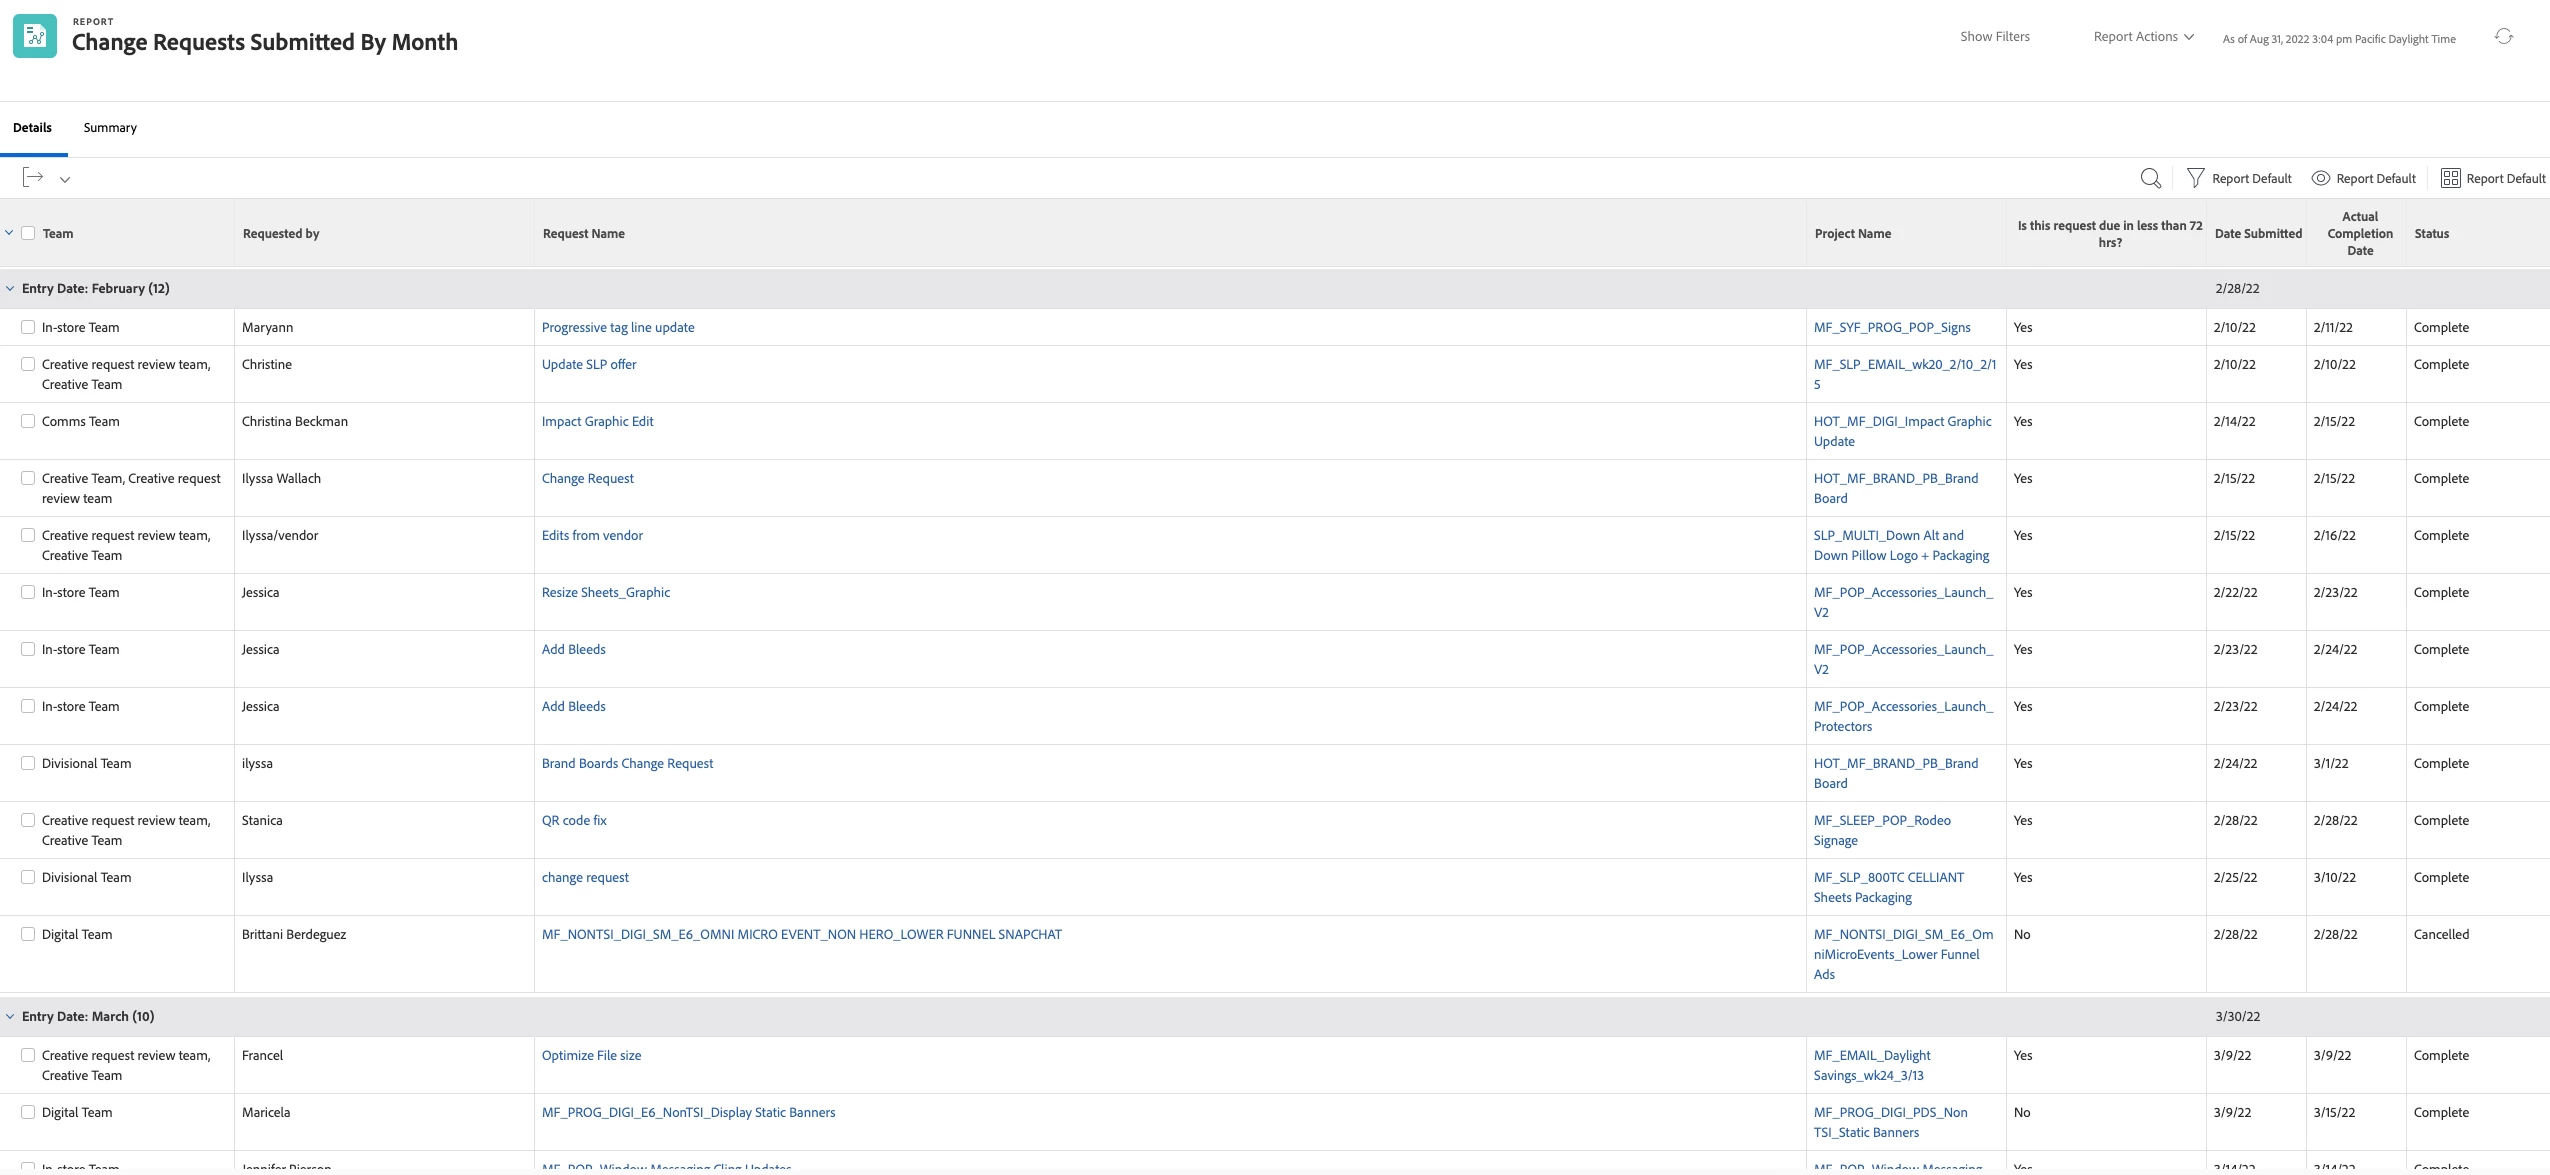
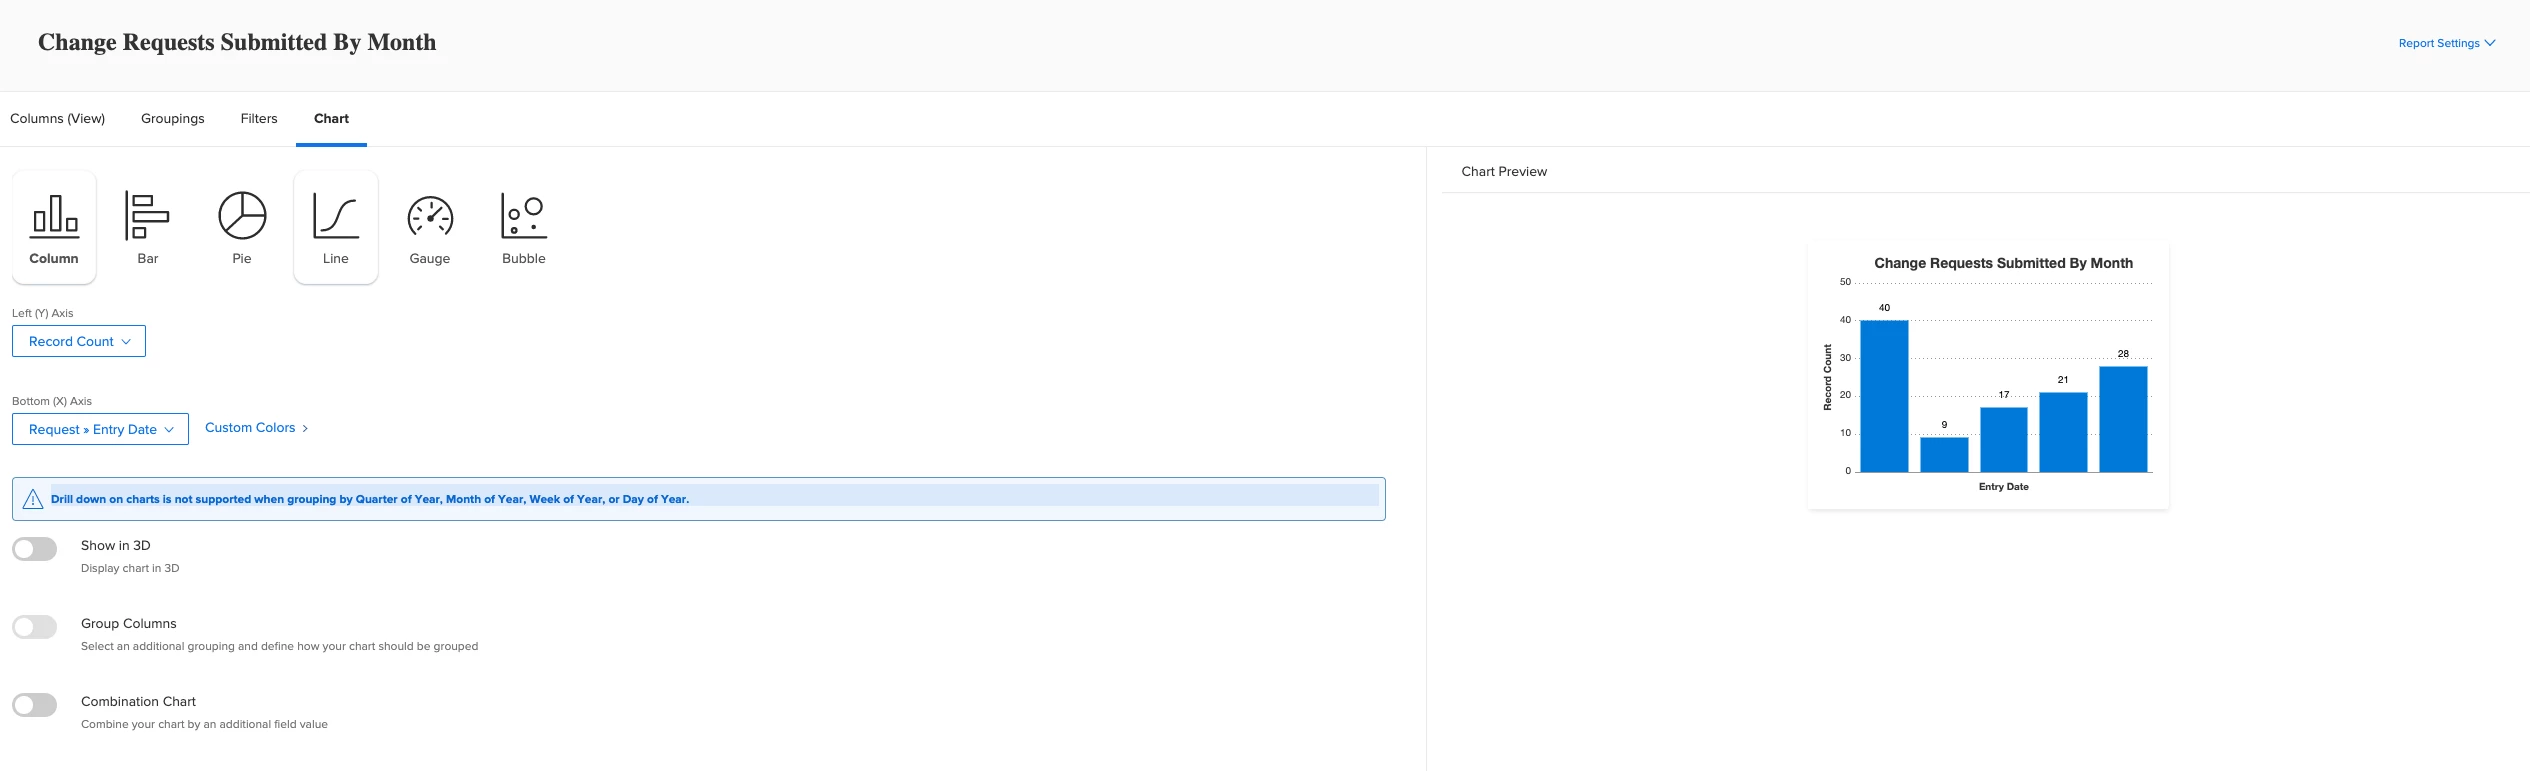
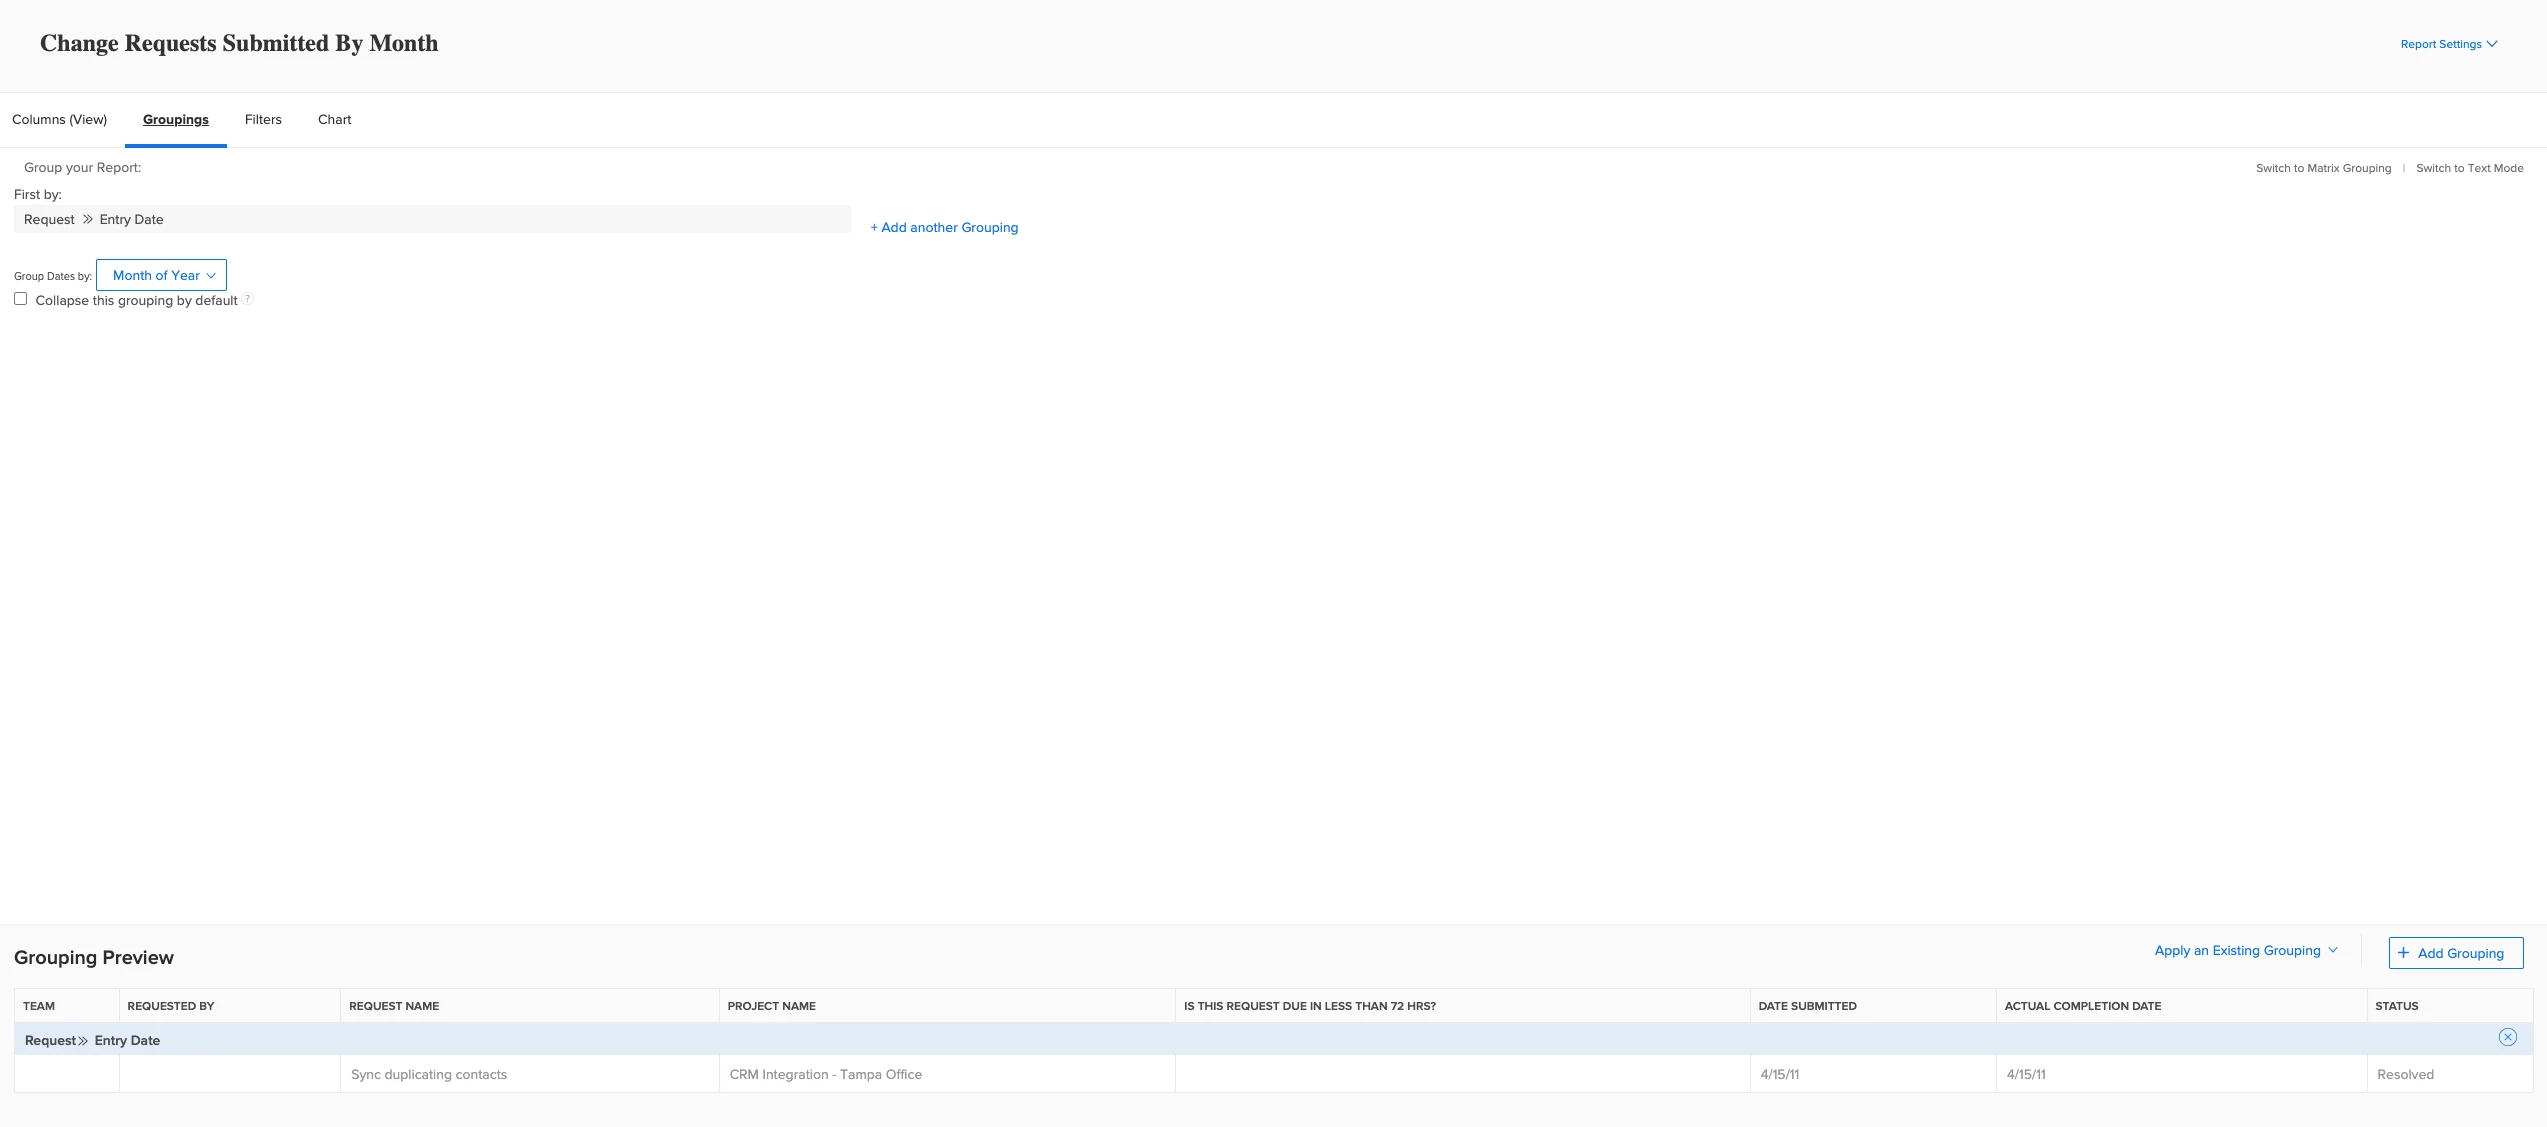
I'm trying to create a chart showing change requests submitted by month chart from my request report in order to visually see the count by month of the year. I can see the groupings under summary and details are pulling up correctly, but the chart section is not pulling up in the report view. Below are screenshots of my settings in the chart and grouping areas with a screenshot of how my report looks. Is there something I'm missing? I've created project report charts successfully, so not sure why the request report chart feature isn't working.


This post is no longer active and is closed to new replies. Need help? Start a new post to ask your question.

3 replies

RhondaGayleTX
New Participant
September 6, 2022

Have you tried Month as opposed to Month of the Year? I am not certain that matters but I believe Month of the Year puts January of all years together in a group, February of all years together, March of all years together, etc. I have not tried to chart Month of the Year, but maybe that has some impact on the chart view?

New Participant
September 1, 2022

I had this happen this morning too, if you try and click into one of your requests and then go back, does the report refresh correctly.  Mine is working now, but I had to go out and back into the report.

laurence_jayawardane
New Participant
September 1, 2022

Hi @andrilitaro1 , just wondering if maybe it's because you're on a line chart rather than a columns chart? I can see both highlighted in the screenshot so it's a bit hard to tell...