Trying to create a chart report based off requests working hours | Community
Skip to main content
New Participant
October 13, 2023
Solved

Trying to create a chart report based off requests working hours

  • October 13, 2023
  • 1 reply
  • 583 views

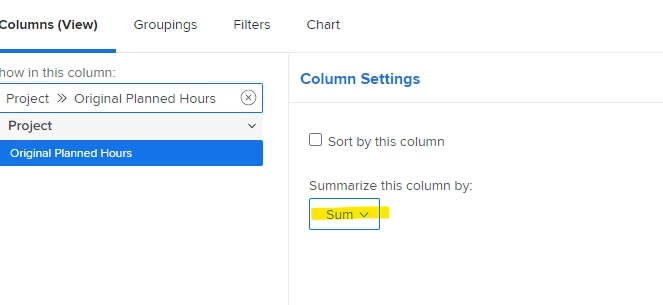
Has anyone created a report based on a requests' working time / planned hours? (Screenshot 1 attached)


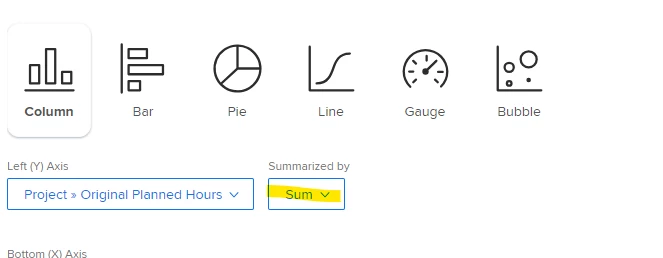
Am I doing something wrong? (screenshot 2 attached) based on my reports groupings and chart (screenshot 3 attached).


The chart pulls through as number of entries as opposed to number of hours from the requests. (screenshot 4 attached).


This post is no longer active and is closed to new replies. Need help? Start a new post to ask your question.
Best answer by VicSellers

Hi @jaxelle - In a chart report, to get the chart to pull the number of hours instead of count, try adding a column for the hours field and then choose Sum under "Summarize this column by" > this column will then show as an option under Charts.


1 reply

VicSellers
VicSellersAccepted solution
New Participant
October 16, 2023

Hi @jaxelle - In a chart report, to get the chart to pull the number of hours instead of count, try adding a column for the hours field and then choose Sum under "Summarize this column by" > this column will then show as an option under Charts.


JaxelleAuthor
New Participant
October 17, 2023

Thanks for your help Victoria.


Nearly there! Screenshots attached. They're all just showing as 0. The 'original planned hours' is coming under 'project' when I want it to be for all the individual requests but it doesn't show as an option/  I don't see anything close enough to the planned hours? any idea? 🙂