AEM Dispatcher - Different Response Time for same Request
Hi All,
I have the below scenario occurring for the STAGE environment -
The response time & its caching action from dispatcher for home page requests varies greatly.
From the AEM dispatcher logs we have the below info -
[29/Nov/2022:01:31:49] [I] "GET /content/brandA/us/en/home.html" -7728ms [publishfarm/0] [actionmiss] stage.brandA.com
[29/Nov/2022:02:16:19] [I] "GET /content/brandA/us/en/home.html" -5857ms [publishfarm/0] [actionmiss] stage.brandA.com
[29/Nov/2022:02:16:23] [I] "GET /content/brandA/us/en/home.html" [publishfarm/0] [actionnone] stage.brandA.com
[29/Nov/2022:02:16:56] [I] "GET /content/brandA/us/en/home.html" -3ms [publishfarm/-] [actionhit] stage.brandA.com
[29/Nov/2022:02:28:02] [I] "GET /content/brandA/us/en/home.html" -3ms [publishfarm/-] [actionhit] stage.brandA.com
[29/Nov/2022:02:31:26] [I] "GET /content/brandA/us/en/home.html" -1886ms [publishfarm/0] [actionmiss] stage.brandA.com
[29/Nov/2022:05:05:41] [I] "GET /content/brandA/us/en/home.html" -5ms [publishfarm/-] [actionhit] stage.brandA.com
[29/Nov/2022:06:32:48] [I] "GET /content/brandA/us/en/home.html" -3ms [publishfarm/-] [actionhit] stage.brandA.com
[29/Nov/2022:07:35:17] [I] "GET /content/brandA/us/en/home.html" 2002280ms [publishfarm/0] [actionnone] stage.brandA.com
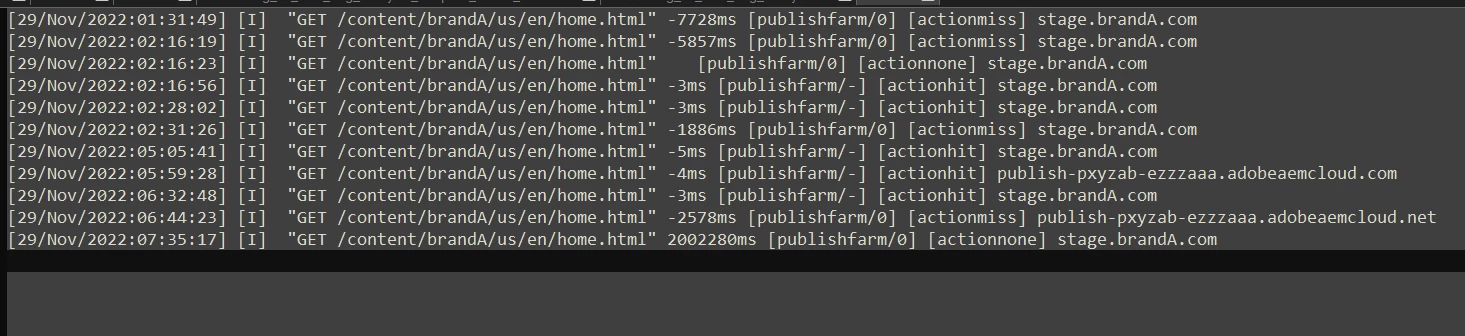
As you can see for the same domain the requests are getting served in 3 ways-
1. [actionhit] indicating 4/9 requests were cached are being served in 3-5ms by publishfarm/-
2. [actionmiss] indicating 3/9 requests were not cached taking varying time - 1.88s, 5.8s, 7.7s by publishfarm/0
3. [actionone] indicating 2/9 requests were not to be cached and took more than 2000s / 30m to be served by publishfarm/0.
Any help on why such a varying response time for the same request URL and for same domain stage.brandA.com ?
@mohit_kbansal, @joerghoh, @arunpatidar, @b_sravan, @kautuk_sahni
Thanks,
Rohan Garg