Investigating the cause of open sessions and bad site performance! | Community
Skip to main content
New Participant
October 5, 2017
Solved

Investigating the cause of open sessions and bad site performance!

  • October 5, 2017
  • 13 replies
  • 4883 views

Hi everyone,

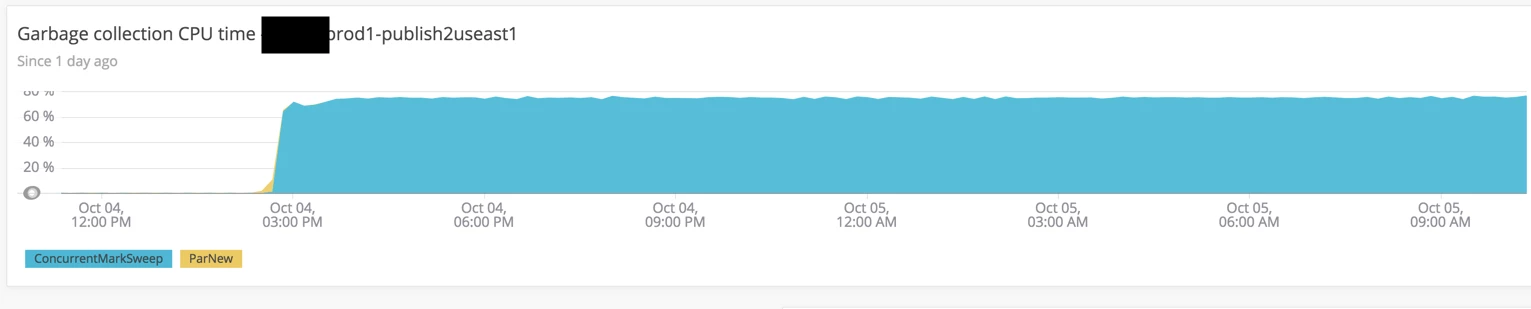
My AEM Production instance is experiencing very high garbage collection CPU Usage and performance issues. I think it might be because of sessions being left open.

I am checking /system/console/jmx on one of the publishers experiencing high garbage collection (over 60% cpu usage over 10+ hours)

I know that by default, there is ~85 SessionStatistics mbeans, and right now there is ~119 SessionStatistics mbeans. I think that very large objects on the heap are being retained due to these sessions staying open. These large objects are related to Search or QueryBuilder (based on a heap dump I checked)

The sessions that are staying open and their start times are directly related to the spikes in garbage collection.

org.apache.jackrabbit.oakSessionStatistics"repository-reader-service@session-434675@Oct 4, 2017 2:39:22 PM"
org.apache.jackrabbit.oakSessionStatistics"repository-reader-service@session-435491@Oct 4, 2017 2:40:34 PM"
org.apache.jackrabbit.oakSessionStatistics"repository-reader-service@session-442302@Oct 4, 2017 2:49:22 PM"
org.apache.jackrabbit.oakSessionStatistics"repository-reader-service@session-443169@Oct 4, 2017 2:50:34 PM"
org.apache.jackrabbit.oakSessionStatistics"repository-reader-service@session-467825@Oct 4, 2017 3:35:40 PM"
org.apache.jackrabbit.oakSessionStatistics"repository-reader-service@session-468804@Oct 4, 2017 3:38:06 PM"
org.apache.jackrabbit.oakSessionStatistics"repository-reader-service@session-471911@Oct 4, 2017 3:45:39 PM"
org.apache.jackrabbit.oakSessionStatistics"repository-reader-service@session-472840@Oct 4, 2017 3:47:59 PM"

These are the sessions being started that seem to spike my  GC CPU usage.

There is about 3 other sessions that are associated with each of these repository-reader-services that are staying open, Two from admin@session, and one from anonymous@session.

Is there anywhere i can find out more information about repository-reader-services sessions being started? What should my next steps be in solving this problem?

Any advice is GREATLY appreciated!

Thank you!

Ian

This post is no longer active and is closed to new replies. Need help? Start a new post to ask your question.
Best answer by joerghoh

Hi,

The JCR queries need memory to perform the query. But when search takes a long time, and more and more queries come in, then the memory usage increase with each query.

If you gc.log doesn't show any increase in garbage collection and you don't get OutOfMemory exceptions, there is no issue with memory at all. Rather focus on improving the searches to speed them up.

Jörg

13 replies

joerghoh
Employee
October 5, 2017

Hi,

First observation: When you have constantly about 60% CPU load on that system, it seems to me that there is more than CPU core involved. If you have problems with your Garbage collection, you typically do Full Garbage Collections, and these are executed normally by 1 thread (= 1 CPU core). So in case of constantly full garbage collections, only 1 core would run at 100%. I don't think that this is the case with you (unless your server has only 2 CPU cores, which I doubt).

I would assume, that this problem is caused by other problems.

My recommended approach would be:

* Check your garbage collection logs (I hope you have it enabled); if you have garbage collection problems, it will manifest itself there, and you have plenty of entries.

* Create threaddumps and analyze them.

I assume, that the threaddumps give most information.

Regarding these "repository-reader-sessions": What version of AEM do you use? Do you have AEM Forms deployed?

kind regards,
Jörg

smacdonald2008
New Participant
October 5, 2017

I checked with Support and they replied:

One thing that they can try to do is to take an advantage on new JDK 1.8 GC

So the average customer usually has "-XX:+UseParallelGC -XX:+UseParallelOldGC -XX:ParallelGCThreads=4 -XX:NewRatio=1" parameters in their startup script for garbage collection

change those to "-XX:NewRatio=1 -XX:MaxMetaspaceSize=2048m -XX:+UseG1GC"

smacdonald2008
New Participant
October 5, 2017

When you say open sessions - do you mean custom services where Developers have opened sessions without closing them once done?