Email Insights dashboard | Community
Skip to main content
New Participant
February 9, 2017
Solved

Email Insights dashboard

  • February 9, 2017
  • 1 reply
  • 1831 views

Can you tell me if the Open Rate and the Click-to-Open rate are for unique leads or is it cumulative over a given period of time?

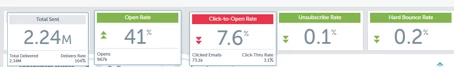
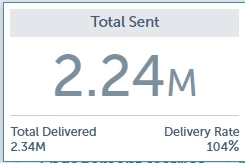
Also why would the "total delivered" be higher than the "Total Sent"

Thank you

This post is no longer active and is closed to new replies. Need help? Start a new post to ask your question.
Best answer by Josh_Hill13

I've had some issues with Email Insights counting abilities. Support has sometimes fixed this.

It also could be related to deleted leads, where you lost the Sent Data.

1 reply

Devraj_Grewal
New Participant
February 9, 2017

Jamie,

The "Open Rate" and "Click-to-Open" rate tiles represent the email activity for any filters you have in place. The red and green colors represent the difference compared to the time period you have indicated in the top right (Custom & Previous period). If you click the calendar date range in the top right, you can uncheck "Compare" and you will then see the overall "Open Rate" and "Click-to-Open" rate not specific to a certain time period.

As for total delivered being higher than total sent, I'm thinking perhaps it is including resends? So maybe it only counted one send, but for a resend, it could count both being delivered eventually.

Josh_Hill13
Josh_Hill13Accepted solution
New Participant
February 9, 2017

I've had some issues with Email Insights counting abilities. Support has sometimes fixed this.

It also could be related to deleted leads, where you lost the Sent Data.

New Participant
February 13, 2017

Thanks  Josh - however we haven't deleted any leads.