Inconsistent opportunity data in the lead performance report?
I haven't been using lead performance report for a while (mostly use RCE + salesforce for reporting), so I might not remember all the details, but when I ran that report today and added in the opportunity columns, many things don't seem to add up.
Here is what one of the reports is showing:
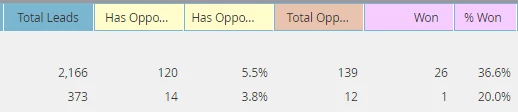
I have 2166 leads, 120 of them have opportunities, 120/2166 = 5.5% of leads have opportunity - no questions here.
Now, why is the number of "total opportunities" different from "has opportunity"?
Here is the documentation article explaining this report Add Opportunity Columns to a Lead Report - Marketo Docs - Product Docs
According to the article:
Has Opportunity - Number of leads who are a primary opportunity contact.
Total Opportunity - Number of all opportunities.
When you hover over the column in the report you get the following definitions:
Has Opportunity - Number of leads who are an opportunity contact
Total Opportunity -Number of opportunities, shown grouped with their primary contact (or first contact if no primary contact exists)
1. So my first question - what is the difference between the "has opportunity" and "total opportunity"? My initial assumption was that "has opportunity" is the number of leads/contacts that were added to opportunity, and "total opps" is the number of actual opportunities leads were added to (one opportunity can have multiple contacts added to it, hence the discrepancy in numbers), but how is it possible then that the number of total opportunities in the first row is larger than the number of leads that have opportunity?
2. Even bigger question is where is the %Won coming from? no matter how you manipulate the numbers, you don't get 36% for the first row.
Divide won by has opp by you get 26/120 = 21.6%
Divide won by total opps 26/139 = 18.7%
So where is marketo getting 36.6% won from?
Am I missing something?
I have hybrid attribution model, but I don't see how attribution model would impact a simple report like this.