Lead Scoring Report | Community
Skip to main content
michellechopin
Community Manager
January 28, 2021
Solved

Lead Scoring Report

  • January 28, 2021
  • 1 reply
  • 5823 views

Hi Community,


Reaching out for your help as always! I am looking to create a Lead Scoring report and found this awesome thread that shared how to do so without having Advance Reporting. I've followed all the steps but the report isn't showing the information how I'd expect.


Here's my process:

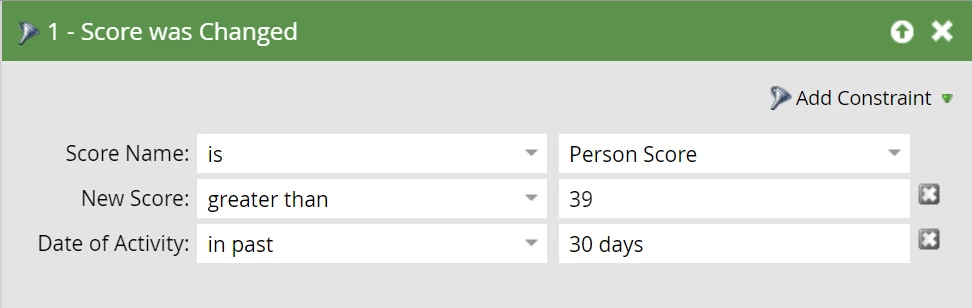
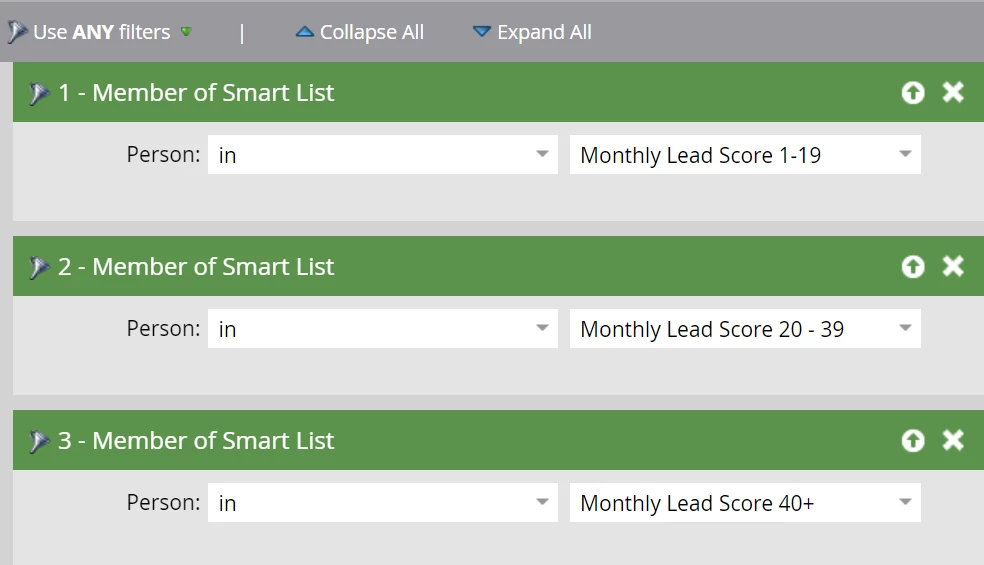
  • Created three Smart Lists to collect leads with scores of 1-19, 20-39, and 40+ for the last month (MQL is 40). Here are the filters for the 40+ grouping as an example

  • Set up a Person Performance Report (assuming this is what the OP meant by Lead Report) with my Smart Lists

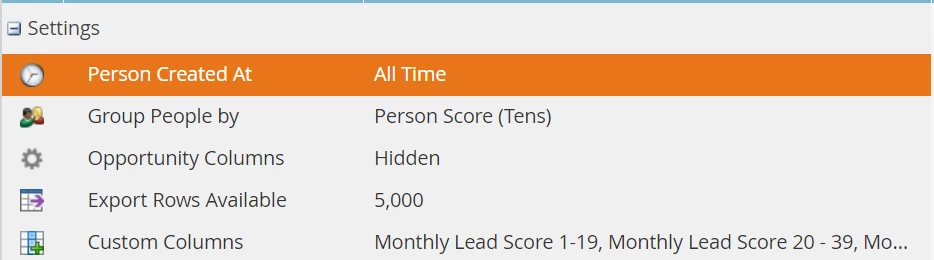
  • Adjusted the Report setup as follows.
    Note: I've gone with The Person Created At = All Time as I want to know, overall, which leads fell into each score group last month (if I change it to = Last Month, it will ignore leads created before that):


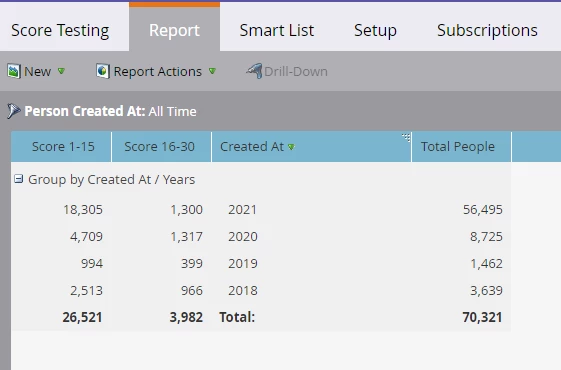
The report looks like this (I adjusted the Grouping to be by the hundreds so it fit the screenshot - results are the same):

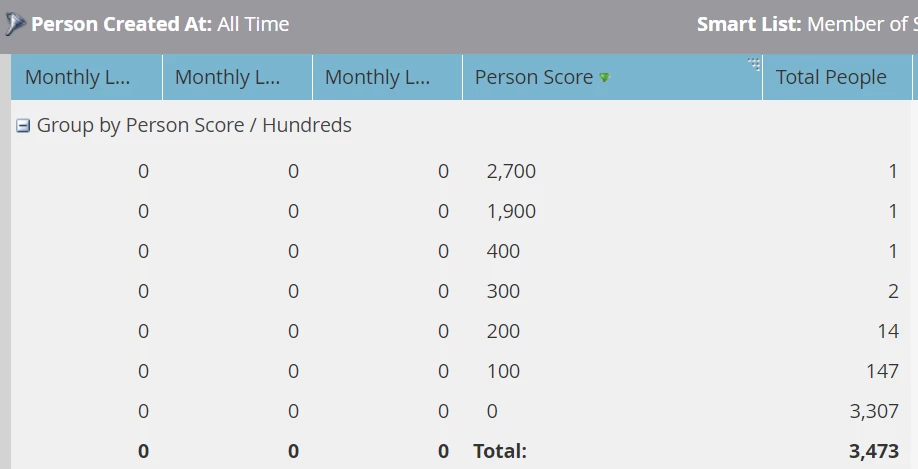
There are 2800+ leads in the first smart list, 770 in the second, and 1500+ in the third so I'm unsure why all those columns say zero (also impressed that someone has managed to amass an enormous score - likely a tester!).


What am I missing here? Is this the wrong report? Am I pulling in the wrong data? Is this whole process wrong?


Any insight is much appreciated, and if there's any other information I can provide, please let me know.

TIA!


This post is no longer active and is closed to new replies. Need help? Start a new post to ask your question.
Best answer by Michael_Florin-2

I don't see an obvious error in your setup. It's the correct report type, and everything looks more or less okay to me.

Couple of thoughts:


You don't need to - or probably should not - use your three Custom Columns Smart Lists in the Smart List section for your report. It might slow it down due to Smart List nesting. Just use the filter "Score was changed between 1 and 100 in past 30 days" here. That will also remove your outlier with the thousands of points.


Secondly, name your Custom Column Smart List in a way so they can specifically function as a column heads. Like "1-19", "20-39" and so on. As short as possible - will make your report more readable.


And I don't think grouping by the same category that is already expressed in your Custom Columns is a good idea. The Custom Columns represent your grouping. (I wish we could remove grouping altogether.)


Here's the same report you built from our instance:


Grouping by "Created Date" is also not ideal, but again: I don't see any reason why your report wouldn't work. Have you refreshed it? 😉


1 reply

Michael_Florin-2
Michael_Florin-2Accepted solution
New Participant
January 28, 2021

I don't see an obvious error in your setup. It's the correct report type, and everything looks more or less okay to me.

Couple of thoughts:


You don't need to - or probably should not - use your three Custom Columns Smart Lists in the Smart List section for your report. It might slow it down due to Smart List nesting. Just use the filter "Score was changed between 1 and 100 in past 30 days" here. That will also remove your outlier with the thousands of points.


Secondly, name your Custom Column Smart List in a way so they can specifically function as a column heads. Like "1-19", "20-39" and so on. As short as possible - will make your report more readable.


And I don't think grouping by the same category that is already expressed in your Custom Columns is a good idea. The Custom Columns represent your grouping. (I wish we could remove grouping altogether.)


Here's the same report you built from our instance:


Grouping by "Created Date" is also not ideal, but again: I don't see any reason why your report wouldn't work. Have you refreshed it? 😉


michellechopin
Community Manager
January 29, 2021

Hey @michael_florin-2,


Thank you so much for your help! I wonder if it was the use of the individual Smart Lists as the Smart List for this report that was causing confusion because as soon as I removed that (and before I did anything else), the report looked far more like your example.


I've made a few adjustments:

  • Person Created = Last 12 Months
  • Group People = Months 
  • Adjusted my Smart Lists to be titled with just the scoring brackets (named these to stand out from other lists in our instance but these are simple enough to find!)

And my report looks as follows:

I'll run that by the team and potentially adjust for various elements if needed. Thank you again so much - this was hugely helpful and I'm so glad it wasn't a massive fix either.


Much appreciated  😀

Michael_Florin-2
New Participant
January 29, 2021

Great! Glad I could help.


One more tip: Create a folder in "Database" for your Custom Column Smart Lists. Now that you see what these reports can do, you'll build dozens more. 🙂 Name that folder "Custom Columns", and tell everybody not to touch these Smart Lists. (If you click their "Used By" tab, Marketo won't show any usage for them, and that might tempt other users to delete them.)